

Maclean et al. - 2002 - Rice almanac source book for the most important e
Maclean et al. - 2002 - Rice almanac source book for the most important e
Maclean et al. - 2002 - Rice almanac source book for the most important e

You also want an ePaper? Increase the reach of your titles
YUMPU automatically turns print PDFs into web optimized ePapers that Google loves.
Percent<br />
100<br />
80<br />
60<br />
40<br />
C<strong>al</strong>orie share<br />
Protein share<br />
Index (1966 = 100)<br />
1,800<br />
1,600<br />
1,400<br />
1,200<br />
1,000<br />
800<br />
600<br />
Production<br />
Area<br />
Yield<br />
20<br />
0<br />
1966 1971 1976 1981 1986 1991 1996 1999<br />
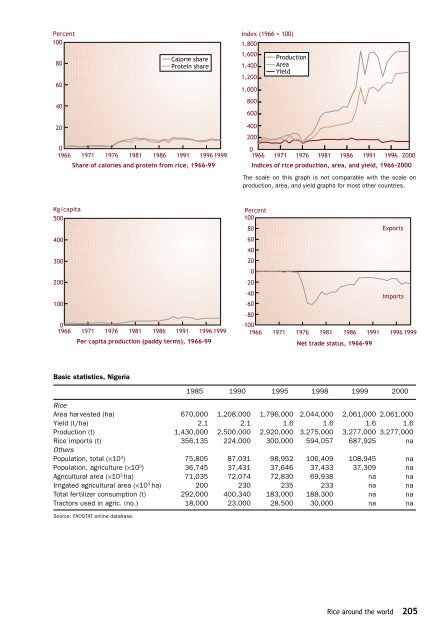
Share of c<strong>al</strong>ories and protein from rice, 1966-99<br />
400<br />
200<br />
0<br />
1966 1971 1976 1981 1986 1991 1996 2000<br />
Indices of rice production, area, and yield, 1966-2000<br />
The sc<strong>al</strong>e on this graph is not comparable with <strong>the</strong> sc<strong>al</strong>e on<br />
production, area, and yield graphs <strong>for</strong> <strong>most</strong> o<strong>the</strong>r countries.<br />
Kg/capita<br />
500<br />
400<br />
300<br />
200<br />
100<br />
0<br />
1966 1971 1976 1981 1986 1991 1996 1999<br />
Per capita production (paddy terms), 1966-99<br />
Percent<br />
100<br />
80<br />
Exports<br />
60<br />
40<br />
20<br />
0<br />
–20<br />
–40<br />
Imports<br />
–60<br />
–80<br />
–100<br />
1966 1971 1976 1981 1986 1991 1996 1999<br />
N<strong>et</strong> trade status, 1966-99<br />
Basic statistics, Nigeria<br />
19851990 19951998 1999 2000<br />
<strong>Rice</strong><br />
Area harvested (ha) 670,000 1,208,000 1,796,000 2,044,000 2,061,000 2,061,000<br />
Yield (t/ha) 2.1 2.1 1.6 1.6 1.6 1.6<br />
Production (t) 1,430,000 2,500,000 2,920,000 3,275,000 3,277,000 3,277,000<br />
<strong>Rice</strong> imports (t) 356,135 224,000 300,000 594,057 687,925 na<br />
O<strong>the</strong>rs<br />
Population, tot<strong>al</strong> (×10 3 ) 75,805 87,031 98,952 106,409 108,945 na<br />
Population, agriculture (×10 3 ) 36,74537,431 37,646 37,433 37,309 na<br />
Agricultur<strong>al</strong> area (×10 3 ha) 71,03572,074 72,830 69,938 na na<br />
Irrigated agricultur<strong>al</strong> area (×10 3 ha) 200 230 235233 na na<br />
Tot<strong>al</strong> fertilizer consumption (t) 292,000 400,340 183,000 188,300 na na<br />
Tractors used in agric. (no.) 18,000 23,000 28,500 30,000 na na<br />
Source: FAOSTAT online database.<br />
<strong>Rice</strong> around <strong>the</strong> world 205


