

Maclean et al. - 2002 - Rice almanac source book for the most important e
Maclean et al. - 2002 - Rice almanac source book for the most important e
Maclean et al. - 2002 - Rice almanac source book for the most important e

Create successful ePaper yourself
Turn your PDF publications into a flip-book with our unique Google optimized e-Paper software.
Percent<br />
100<br />
Index (1966 = 100)<br />
800<br />
80<br />
C<strong>al</strong>orie share<br />
Protein share<br />
600<br />
Production<br />
Area<br />
Yield<br />
60<br />
40<br />
400<br />
20<br />
200<br />
0<br />
1966 1971 1976 1981 1986 1991 1996 1999<br />
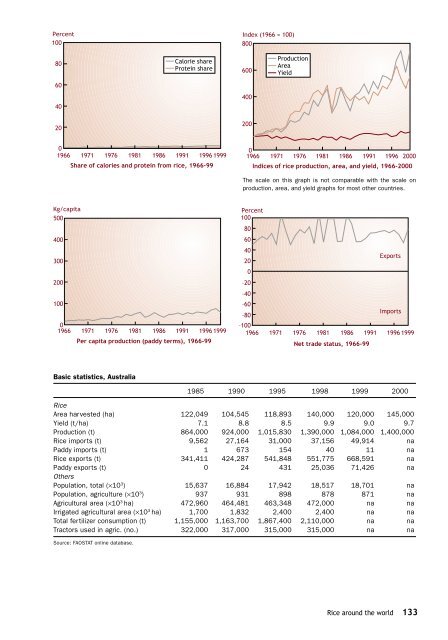
Share of c<strong>al</strong>ories and protein from rice, 1966-99<br />
0<br />
1966 1971 1976 1981 1986 1991 1996 2000<br />
Indices of rice production, area, and yield, 1966-2000<br />
The sc<strong>al</strong>e on this graph is not comparable with <strong>the</strong> sc<strong>al</strong>e on<br />
production, area, and yield graphs <strong>for</strong> <strong>most</strong> o<strong>the</strong>r countries.<br />
Kg/capita<br />
500<br />
400<br />
300<br />
200<br />
100<br />
0<br />
1966 1971 1976 1981 1986 1991 1996 1999<br />
Per capita production (paddy terms), 1966-99<br />
Percent<br />
100<br />
80<br />
60<br />
40<br />
Exports<br />
20<br />
0<br />
–20<br />
–40<br />
–60<br />
Imports<br />
–80<br />
–100<br />
1966 1971 1976 1981 1986 1991 1996 1999<br />
N<strong>et</strong> trade status, 1966-99<br />
Basic statistics, Austr<strong>al</strong>ia<br />
1985 1990 1995 1998 1999 2000<br />
<strong>Rice</strong><br />
Area harvested (ha) 122,049 104,545 118,893 140,000 120,000 145,000<br />
Yield (t/ha) 7.1 8.8 8.5 9.9 9.0 9.7<br />
Production (t) 864,000 924,000 1,015,830 1,390,000 1,084,000 1,400,000<br />
<strong>Rice</strong> imports (t) 9,562 27,164 31,000 37,156 49,914 na<br />
Paddy imports (t) 1 673 154 40 11 na<br />
<strong>Rice</strong> exports (t) 341,411 424,287 541,848 551,775 668,591 na<br />
Paddy exports (t) 0 24 431 25,036 71,426 na<br />
O<strong>the</strong>rs<br />
Population, tot<strong>al</strong> (×10 3 ) 15,637 16,884 17,942 18,517 18,701 na<br />
Population, agriculture (×10 3 ) 937 931 898 878 871 na<br />
Agricultur<strong>al</strong> area (×10 3 ha) 472,960 464,481 463,348 472,000 na na<br />
Irrigated agricultur<strong>al</strong> area (×10 3 ha) 1,700 1,832 2,400 2,400 na na<br />
Tot<strong>al</strong> fertilizer consumption (t) 1,155,000 1,163,700 1,867,400 2,110,000 na na<br />
Tractors used in agric. (no.) 322,000 317,000 315,000 315,000 na na<br />
Source: FAOSTAT online database.<br />
<strong>Rice</strong> around <strong>the</strong> world 133


