

Maclean et al. - 2002 - Rice almanac source book for the most important e
Maclean et al. - 2002 - Rice almanac source book for the most important e
Maclean et al. - 2002 - Rice almanac source book for the most important e

You also want an ePaper? Increase the reach of your titles
YUMPU automatically turns print PDFs into web optimized ePapers that Google loves.
Percent<br />
100<br />
Index (1966 = 100)<br />
500<br />
80<br />
C<strong>al</strong>orie share<br />
Protein share<br />
400<br />
Production<br />
Area<br />
Yield<br />
60<br />
300<br />
40<br />
200<br />
20<br />
100<br />
0<br />
1966 1971 1976 1981 1986 1991 1996 1999<br />
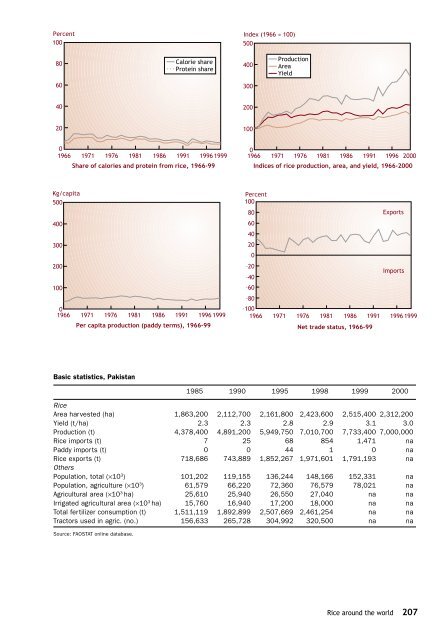
Share of c<strong>al</strong>ories and protein from rice, 1966-99<br />
0<br />
1966 1971 1976 1981 1986 1991 1996 2000<br />
Indices of rice production, area, and yield, 1966-2000<br />
Kg/capita<br />
500<br />
400<br />
300<br />
200<br />
100<br />
0<br />
1966 1971 1976 1981 1986 1991 1996 1999<br />
Per capita production (paddy terms), 1966-99<br />
Percent<br />
100<br />
80<br />
Exports<br />
60<br />
40<br />
20<br />
0<br />
–20<br />
Imports<br />
–40<br />
–60<br />
–80<br />
–100<br />
1966 1971 1976 1981 1986 1991 1996 1999<br />
N<strong>et</strong> trade status, 1966-99<br />
Basic statistics, Pakistan<br />
1985 1990 1995 1998 1999 2000<br />
<strong>Rice</strong><br />
Area harvested (ha) 1,863,200 2,112,700 2,161,800 2,423,600 2,515,400 2,312,200<br />
Yield (t/ha) 2.3 2.3 2.8 2.9 3.1 3.0<br />
Production (t) 4,378,400 4,891,200 5,949,750 7,010,700 7,733,400 7,000,000<br />
<strong>Rice</strong> imports (t) 7 25 68 854 1,471 na<br />
Paddy imports (t) 0 0 44 1 0 na<br />
<strong>Rice</strong> exports (t) 718,686 743,889 1,852,267 1,971,601 1,791,193 na<br />
O<strong>the</strong>rs<br />
Population, tot<strong>al</strong> (×10 3 ) 101,202 119,155 136,244 148,166 152,331 na<br />
Population, agriculture (×10 3 ) 61,579 66,220 72,360 76,579 78,021 na<br />
Agricultur<strong>al</strong> area (×10 3 ha) 25,610 25,940 26,550 27,040 na na<br />
Irrigated agricultur<strong>al</strong> area (×10 3 ha) 15,760 16,940 17,200 18,000 na na<br />
Tot<strong>al</strong> fertilizer consumption (t) 1,511,119 1,892,899 2,507,669 2,461,254 na na<br />
Tractors used in agric. (no.) 156,633 265,728 304,992 320,500 na na<br />
Source: FAOSTAT online database.<br />
<strong>Rice</strong> around <strong>the</strong> world 207


