

Maclean et al. - 2002 - Rice almanac source book for the most important e
Maclean et al. - 2002 - Rice almanac source book for the most important e
Maclean et al. - 2002 - Rice almanac source book for the most important e

Create successful ePaper yourself
Turn your PDF publications into a flip-book with our unique Google optimized e-Paper software.
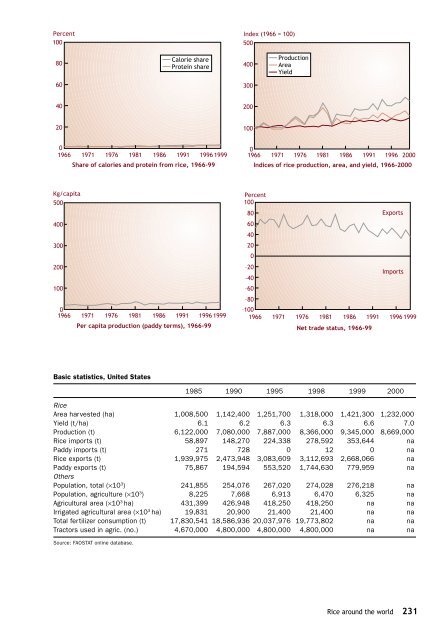
Percent<br />
100<br />
Index (1966 = 100)<br />
500<br />
80<br />
C<strong>al</strong>orie share<br />
Protein share<br />
400<br />
Production<br />
Area<br />
Yield<br />
60<br />
300<br />
40<br />
200<br />
20<br />
100<br />
0<br />
1966 1971 1976 1981 1986 1991 1996 1999<br />
Share of c<strong>al</strong>ories and protein from rice, 1966-99<br />
0<br />
1966 1971 1976 1981 1986 1991 1996 2000<br />
Indices of rice production, area, and yield, 1966-2000<br />
Kg/capita<br />
500<br />
400<br />
300<br />
200<br />
100<br />
0<br />
1966 1971 1976 1981 1986 1991 1996 1999<br />
Per capita production (paddy terms), 1966-99<br />
Percent<br />
100<br />
80<br />
Exports<br />
60<br />
40<br />
20<br />
0<br />
–20<br />
Imports<br />
–40<br />
–60<br />
–80<br />
–100<br />
1966 1971 1976 1981 1986 1991 1996 1999<br />
N<strong>et</strong> trade status, 1966-99<br />
Basic statistics, United States<br />
1985 1990 1995 1998 1999 2000<br />
<strong>Rice</strong><br />
Area harvested (ha) 1,008,500 1,142,400 1,251,700 1,318,000 1,421,300 1,232,000<br />
Yield (t/ha) 6.1 6.26.3 6.3 6.6 7.0<br />
Production (t) 6,122,000 7,080,000 7,887,000 8,366,000 9,345,000 8,669,000<br />
<strong>Rice</strong> imports (t) 58,897 148,270 224,338 278,592 353,644 na<br />
Paddy imports (t) 271 728 0 12 0 na<br />
<strong>Rice</strong> exports (t) 1,939,975 2,473,948 3,083,609 3,112,693 2,668,066 na<br />
Paddy exports (t) 75,867 194,594 553,520 1,744,630 779,959 na<br />
O<strong>the</strong>rs<br />
Population, tot<strong>al</strong> (×10 3 ) 241,855 254,076 267,020 274,028 276,218 na<br />
Population, agriculture (×10 3 ) 8,225 7,668 6,913 6,470 6,325 na<br />
Agricultur<strong>al</strong> area (×10 3 ha) 431,399 426,948 418,250 418,250 na na<br />
Irrigated agricultur<strong>al</strong> area (×10 3 ha) 19,831 20,900 21,400 21,400 na na<br />
Tot<strong>al</strong> fertilizer consumption (t) 17,830,541 18,586,936 20,037,976 19,773,802 na na<br />
Tractors used in agric. (no.) 4,670,000 4,800,000 4,800,000 4,800,000 na na<br />
Source: FAOSTAT online database.<br />
<strong>Rice</strong> around <strong>the</strong> world 231


