

Maclean et al. - 2002 - Rice almanac source book for the most important e
Maclean et al. - 2002 - Rice almanac source book for the most important e
Maclean et al. - 2002 - Rice almanac source book for the most important e

Create successful ePaper yourself
Turn your PDF publications into a flip-book with our unique Google optimized e-Paper software.
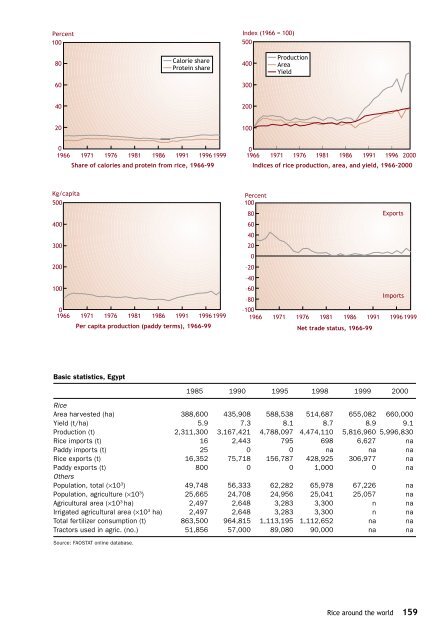
Percent<br />
100<br />
Index (1966 = 100)<br />
500<br />
80<br />
C<strong>al</strong>orie share<br />
Protein share<br />
400<br />
Production<br />
Area<br />
Yield<br />
60<br />
300<br />
40<br />
200<br />
20<br />
100<br />
0<br />
1966 1971 1976 1981 1986 1991 1996 1999<br />
Share of c<strong>al</strong>ories and protein from rice, 1966-99<br />
0<br />
1966 1971 1976 1981 1986 1991 1996 2000<br />
Indices of rice production, area, and yield, 1966-2000<br />
Kg/capita<br />
500<br />
400<br />
300<br />
200<br />
100<br />
0<br />
1966 1971 1976 1981 1986 1991 1996 1999<br />
Per capita production (paddy terms), 1966-99<br />
Percent<br />
100<br />
80<br />
Exports<br />
60<br />
40<br />
20<br />
0<br />
–20<br />
–40<br />
–60<br />
Imports<br />
–80<br />
–100<br />
1966 1971 1976 1981 1986 1991 1996 1999<br />
N<strong>et</strong> trade status, 1966-99<br />
Basic statistics, Egypt<br />
1985 1990 1995 1998 1999 2000<br />
<strong>Rice</strong><br />
Area harvested (ha) 388,600 435,908 588,538 514,687 655,082 660,000<br />
Yield (t/ha) 5.9 7.3 8.1 8.7 8.9 9.1<br />
Production (t) 2,311,300 3,167,421 4,788,097 4,474,110 5,816,960 5,996,830<br />
<strong>Rice</strong> imports (t) 16 2,443 795 698 6,627 na<br />
Paddy imports (t) 25 0 0 na na na<br />
<strong>Rice</strong> exports (t) 16,352 75,718 156,787 428,925 306,977 na<br />
Paddy exports (t) 800 0 0 1,000 0 na<br />
O<strong>the</strong>rs<br />
Population, tot<strong>al</strong> (×10 3 ) 49,748 56,333 62,282 65,978 67,226 na<br />
Population, agriculture (×10 3 ) 25,665 24,708 24,956 25,041 25,057 na<br />
Agricultur<strong>al</strong> area (×10 3 ha) 2,497 2,648 3,283 3,300 n na<br />
Irrigated agricultur<strong>al</strong> area (×10 3 ha) 2,497 2,648 3,283 3,300 n na<br />
Tot<strong>al</strong> fertilizer consumption (t) 863,500 964,815 1,113,195 1,112,652 na na<br />
Tractors used in agric. (no.) 51,856 57,000 89,080 90,000 na na<br />
Source: FAOSTAT online database.<br />
<strong>Rice</strong> around <strong>the</strong> world 159


