

Maclean et al. - 2002 - Rice almanac source book for the most important e
Maclean et al. - 2002 - Rice almanac source book for the most important e
Maclean et al. - 2002 - Rice almanac source book for the most important e

Create successful ePaper yourself
Turn your PDF publications into a flip-book with our unique Google optimized e-Paper software.
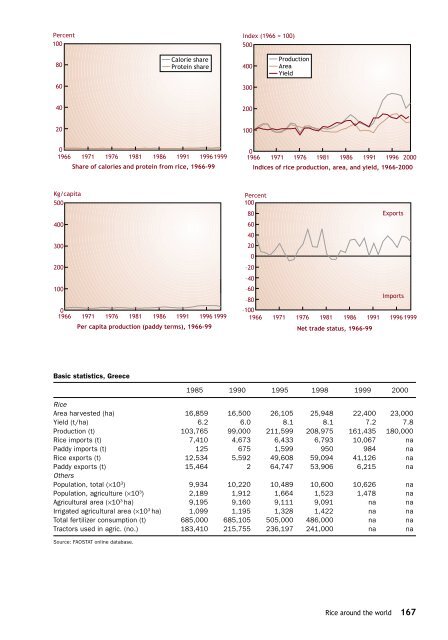
Percent<br />
100<br />
Index (1966 = 100)<br />
500<br />
80<br />
C<strong>al</strong>orie share<br />
Protein share<br />
400<br />
Production<br />
Area<br />
Yield<br />
60<br />
300<br />
40<br />
200<br />
20<br />
100<br />
0<br />
1966 1971 1976 1981 1986 1991 1996 1999<br />
Share of c<strong>al</strong>ories and protein from rice, 1966-99<br />
0<br />
1966 1971 1976 1981 1986 1991 1996 2000<br />
Indices of rice production, area, and yield, 1966-2000<br />
Kg/capita<br />
500<br />
400<br />
300<br />
200<br />
100<br />
0<br />
1966 1971 1976 1981 1986 1991 1996 1999<br />
Per capita production (paddy terms), 1966-99<br />
Percent<br />
100<br />
80<br />
Exports<br />
60<br />
40<br />
20<br />
0<br />
–20<br />
–40<br />
–60<br />
Imports<br />
–80<br />
–100<br />
1966 1971 1976 1981 1986 1991 1996 1999<br />
N<strong>et</strong> trade status, 1966-99<br />
Basic statistics, Greece<br />
1985 1990 1995 1998 1999 2000<br />
<strong>Rice</strong><br />
Area harvested (ha) 16,859 16,500 26,105 25,948 22,400 23,000<br />
Yield (t/ha) 6.2 6.0 8.1 8.1 7.2 7.8<br />
Production (t) 103,765 99,000 211,599 208,975 161,435 180,000<br />
<strong>Rice</strong> imports (t) 7,410 4,673 6,433 6,793 10,067 na<br />
Paddy imports (t) 125 675 1,599 950 984na<br />
<strong>Rice</strong> exports (t) 12,534 5,592 49,608 59,094 41,126 na<br />
Paddy exports (t) 15,464 2 64,747 53,906 6,215 na<br />
O<strong>the</strong>rs<br />
Population, tot<strong>al</strong> (×10 3 ) 9,93410,220 10,489 10,600 10,626 na<br />
Population, agriculture (×10 3 ) 2,189 1,912 1,6641,523 1,478 na<br />
Agricultur<strong>al</strong> area (×10 3 ha) 9,195 9,160 9,111 9,091 na na<br />
Irrigated agricultur<strong>al</strong> area (×10 3 ha) 1,099 1,195 1,328 1,422 na na<br />
Tot<strong>al</strong> fertilizer consumption (t) 685,000 685,105 505,000 486,000 na na<br />
Tractors used in agric. (no.) 183,410 215,755 236,197 241,000 na na<br />
Source: FAOSTAT online database.<br />
<strong>Rice</strong> around <strong>the</strong> world 167


