

Maclean et al. - 2002 - Rice almanac source book for the most important e
Maclean et al. - 2002 - Rice almanac source book for the most important e
Maclean et al. - 2002 - Rice almanac source book for the most important e

You also want an ePaper? Increase the reach of your titles
YUMPU automatically turns print PDFs into web optimized ePapers that Google loves.
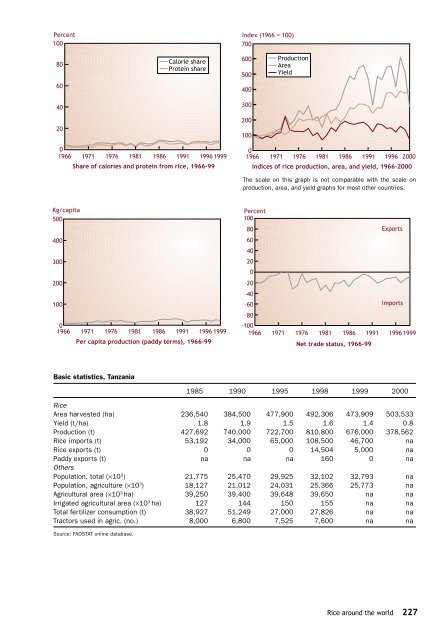
Percent<br />
100<br />
Index (1966 = 100)<br />
700<br />
80<br />
C<strong>al</strong>orie share<br />
Protein share<br />
600<br />
500<br />
Production<br />
Area<br />
Yield<br />
60<br />
400<br />
40<br />
300<br />
20<br />
200<br />
100<br />
0<br />
1966 1971 1976 1981 1986 1991 1996 1999<br />
Share of c<strong>al</strong>ories and protein from rice, 1966-99<br />
0<br />
1966 1971 1976 1981 1986 1991 1996 2000<br />
Indices of rice production, area, and yield, 1966-2000<br />
The sc<strong>al</strong>e on this graph is not comparable with <strong>the</strong> sc<strong>al</strong>e on<br />
production, area, and yield graphs <strong>for</strong> <strong>most</strong> o<strong>the</strong>r countries.<br />
Kg/capita<br />
500<br />
400<br />
300<br />
200<br />
100<br />
0<br />
1966 1971 1976 1981 1986 1991 1996 1999<br />
Per capita production (paddy terms), 1966-99<br />
Percent<br />
100<br />
80<br />
Exports<br />
60<br />
40<br />
20<br />
0<br />
–20<br />
–40<br />
–60<br />
Imports<br />
–80<br />
–100<br />
1966 1971 1976 1981 1986 1991 1996 1999<br />
N<strong>et</strong> trade status, 1966-99<br />
Basic statistics, Tanzania<br />
1985 1990 1995 1998 1999 2000<br />
<strong>Rice</strong><br />
Area harvested (ha) 236,540 384,500 477,900 492,306 473,909 503,533<br />
Yield (t/ha) 1.8 1.9 1.5 1.6 1.4 0.8<br />
Production (t) 427,692 740,000 722,700 810,800 676,000 378,562<br />
<strong>Rice</strong> imports (t) 53,192 34,000 65,000 108,500 46,700 na<br />
<strong>Rice</strong> exports (t) 0 0 0 14,504 5,000 na<br />
Paddy exports (t) na na na 160 0 na<br />
O<strong>the</strong>rs<br />
Population, tot<strong>al</strong> (×10 3 ) 21,775 25,470 29,925 32,102 32,793 na<br />
Population, agriculture (×10 3 ) 18,127 21,012 24,031 25,366 25,773 na<br />
Agricultur<strong>al</strong> area (×10 3 ha) 39,250 39,400 39,648 39,650 na na<br />
Irrigated agricultur<strong>al</strong> area (×10 3 ha) 127 144 150 155 na na<br />
Tot<strong>al</strong> fertilizer consumption (t) 38,927 51,249 27,000 27,826 na na<br />
Tractors used in agric. (no.) 8,000 6,800 7,525 7,600 na na<br />
Source: FAOSTAT online database.<br />
<strong>Rice</strong> around <strong>the</strong> world 227


