

Maclean et al. - 2002 - Rice almanac source book for the most important e
Maclean et al. - 2002 - Rice almanac source book for the most important e
Maclean et al. - 2002 - Rice almanac source book for the most important e

You also want an ePaper? Increase the reach of your titles
YUMPU automatically turns print PDFs into web optimized ePapers that Google loves.
Percent<br />
100<br />
Index (1966 = 100)<br />
1200<br />
80<br />
60<br />
C<strong>al</strong>orie share<br />
Protein share<br />
1000<br />
800<br />
600<br />
Production<br />
Area<br />
Yield<br />
40<br />
400<br />
20<br />
200<br />
0<br />
1966 1971 1976 1981 1986 1991 1996 1999<br />
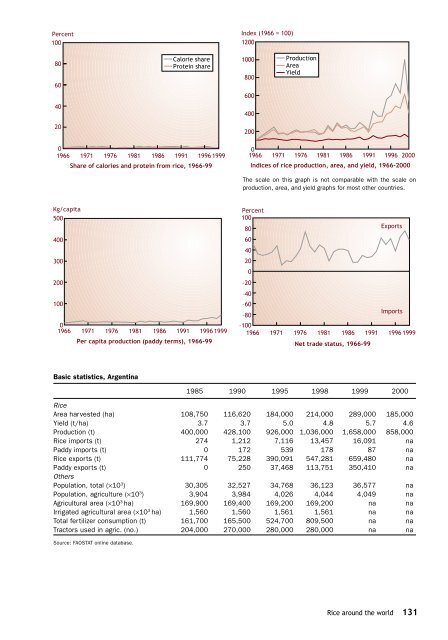
Share of c<strong>al</strong>ories and protein from rice, 1966-99<br />
0<br />
1966 1971 1976 1981 1986 1991 1996 2000<br />
Indices of rice production, area, and yield, 1966-2000<br />
The sc<strong>al</strong>e on this graph is not comparable with <strong>the</strong> sc<strong>al</strong>e on<br />
production, area, and yield graphs <strong>for</strong> <strong>most</strong> o<strong>the</strong>r countries.<br />
Kg/capita<br />
500<br />
400<br />
300<br />
200<br />
100<br />
0<br />
1966 1971 1976 1981 1986 1991 1996 1999<br />
Per capita production (paddy terms), 1966-99<br />
Percent<br />
100<br />
80<br />
Exports<br />
60<br />
40<br />
20<br />
0<br />
–20<br />
–40<br />
–60<br />
Imports<br />
–80<br />
–100<br />
1966 1971 1976 1981 1986 1991 1996 1999<br />
N<strong>et</strong> trade status, 1966-99<br />
Basic statistics, Argentina<br />
1985 1990 1995 1998 1999 2000<br />
<strong>Rice</strong><br />
Area harvested (ha) 108,750 116,620 184,000 214,000 289,000 185,000<br />
Yield (t/ha) 3.7 3.7 5.0 4.8 5.7 4.6<br />
Production (t) 400,000 428,100 926,000 1,036,000 1,658,000 858,000<br />
<strong>Rice</strong> imports (t) 2741,212 7,116 13,457 16,091 na<br />
Paddy imports (t) 0 172 539 178 87 na<br />
<strong>Rice</strong> exports (t) 111,774 75,228 390,091 547,281 659,480 na<br />
Paddy exports (t) 0 250 37,468 113,751 350,410 na<br />
O<strong>the</strong>rs<br />
Population, tot<strong>al</strong> (×10 3 ) 30,305 32,527 34,768 36,123 36,577 na<br />
Population, agriculture (×10 3 ) 3,904 3,984 4,026 4,044 4,049 na<br />
Agricultur<strong>al</strong> area (×10 3 ha) 169,900 169,400 169,200 169,200 na na<br />
Irrigated agricultur<strong>al</strong> area (×10 3 ha) 1,560 1,560 1,561 1,561 na na<br />
Tot<strong>al</strong> fertilizer consumption (t) 161,700 165,500 524,700 809,500 na na<br />
Tractors used in agric. (no.) 204,000 270,000 280,000 280,000 na na<br />
Source: FAOSTAT online database.<br />
<strong>Rice</strong> around <strong>the</strong> world 131


