

Maclean et al. - 2002 - Rice almanac source book for the most important e
Maclean et al. - 2002 - Rice almanac source book for the most important e
Maclean et al. - 2002 - Rice almanac source book for the most important e

You also want an ePaper? Increase the reach of your titles
YUMPU automatically turns print PDFs into web optimized ePapers that Google loves.
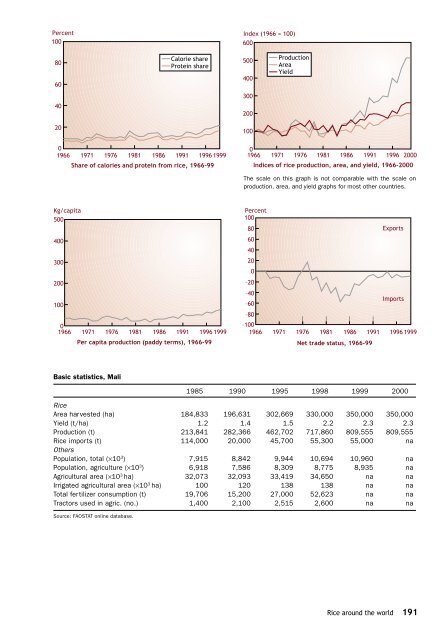
Percent<br />
100<br />
Index (1966 = 100)<br />
600<br />
80<br />
60<br />
C<strong>al</strong>orie share<br />
Protein share<br />
500<br />
400<br />
Production<br />
Area<br />
Yield<br />
300<br />
40<br />
200<br />
20<br />
100<br />
0<br />
1966 1971 1976 1981 1986 1991 1996 1999<br />
Share of c<strong>al</strong>ories and protein from rice, 1966-99<br />
0<br />
1966 1971 1976 1981 1986 1991 1996 2000<br />
Indices of rice production, area, and yield, 1966-2000<br />
The sc<strong>al</strong>e on this graph is not comparable with <strong>the</strong> sc<strong>al</strong>e on<br />
production, area, and yield graphs <strong>for</strong> <strong>most</strong> o<strong>the</strong>r countries.<br />
Kg/capita<br />
500<br />
400<br />
300<br />
200<br />
100<br />
0<br />
1966 1971 1976 1981 1986 1991 1996 1999<br />
Per capita production (paddy terms), 1966-99<br />
Percent<br />
100<br />
80<br />
Exports<br />
60<br />
40<br />
20<br />
0<br />
–20<br />
–40<br />
–60<br />
Imports<br />
–80<br />
–100<br />
1966 1971 1976 1981 1986 1991 1996 1999<br />
N<strong>et</strong> trade status, 1966-99<br />
Basic statistics, M<strong>al</strong>i<br />
1985 1990 1995 1998 1999 2000<br />
<strong>Rice</strong><br />
Area harvested (ha) 184,833 196,631 302,669 330,000 350,000 350,000<br />
Yield (t/ha) 1.2 1.4 1.5 2.2 2.3 2.3<br />
Production (t) 213,841 282,366 462,702 717,860 809,555 809,555<br />
<strong>Rice</strong> imports (t) 114,000 20,000 45,700 55,300 55,000 na<br />
O<strong>the</strong>rs<br />
Population, tot<strong>al</strong> (×10 3 ) 7,915 8,842 9,944 10,694 10,960 na<br />
Population, agriculture (×10 3 ) 6,918 7,586 8,309 8,775 8,935 na<br />
Agricultur<strong>al</strong> area (×10 3 ha) 32,073 32,093 33,419 34,650 na na<br />
Irrigated agricultur<strong>al</strong> area (×10 3 ha) 100 120 138 138 na na<br />
Tot<strong>al</strong> fertilizer consumption (t) 19,706 15,200 27,000 52,623 na na<br />
Tractors used in agric. (no.) 1,400 2,100 2,515 2,600 na na<br />
Source: FAOSTAT online database.<br />
<strong>Rice</strong> around <strong>the</strong> world 191


