

Maclean et al. - 2002 - Rice almanac source book for the most important e
Maclean et al. - 2002 - Rice almanac source book for the most important e
Maclean et al. - 2002 - Rice almanac source book for the most important e

Create successful ePaper yourself
Turn your PDF publications into a flip-book with our unique Google optimized e-Paper software.
Percent<br />
100<br />
Index (1966 = 100)<br />
500<br />
80<br />
C<strong>al</strong>orie share<br />
Protein share<br />
400<br />
Production<br />
Area<br />
Yield<br />
60<br />
300<br />
40<br />
200<br />
20<br />
100<br />
0<br />
1966 1971 1976 1981 1986 1991 1996 1999<br />
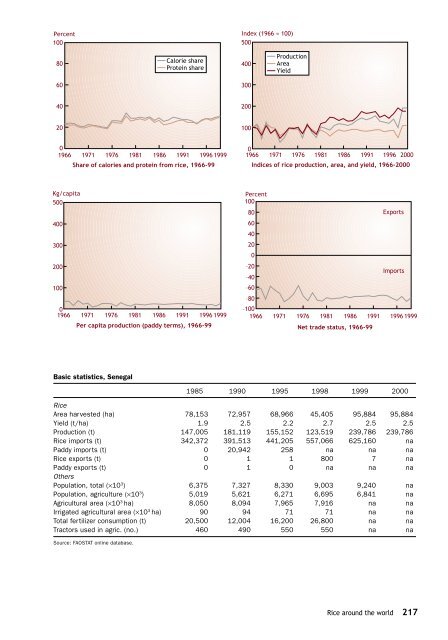
Share of c<strong>al</strong>ories and protein from rice, 1966-99<br />
0<br />
1966 1971 1976 1981 1986 1991 1996 2000<br />
Indices of rice production, area, and yield, 1966-2000<br />
Kg/capita<br />
500<br />
400<br />
300<br />
200<br />
100<br />
0<br />
1966 1971 1976 1981 1986 1991 1996 1999<br />
Per capita production (paddy terms), 1966-99<br />
Percent<br />
100<br />
80<br />
Exports<br />
60<br />
40<br />
20<br />
0<br />
–20<br />
Imports<br />
–40<br />
–60<br />
–80<br />
–100<br />
1966 1971 1976 1981 1986 1991 1996 1999<br />
N<strong>et</strong> trade status, 1966-99<br />
Basic statistics, Seneg<strong>al</strong><br />
1985 1990 1995 1998 1999 2000<br />
<strong>Rice</strong><br />
Area harvested (ha) 78,153 72,957 68,966 45,405 95,884 95,884<br />
Yield (t/ha) 1.9 2.5 2.2 2.7 2.5 2.5<br />
Production (t) 147,005 181,119 155,152 123,519 239,786 239,786<br />
<strong>Rice</strong> imports (t) 342,372 391,513 441,205 557,066 625,160 na<br />
Paddy imports (t) 0 20,942 258 na na na<br />
<strong>Rice</strong> exports (t) 0 1 1 800 7 na<br />
Paddy exports (t) 0 1 0 na na na<br />
O<strong>the</strong>rs<br />
Population, tot<strong>al</strong> (×10 3 ) 6,375 7,327 8,330 9,003 9,240 na<br />
Population, agriculture (×10 3 ) 5,019 5,621 6,271 6,695 6,841 na<br />
Agricultur<strong>al</strong> area (×10 3 ha) 8,050 8,094 7,965 7,916 na na<br />
Irrigated agricultur<strong>al</strong> area (×10 3 ha) 90 94 71 71 na na<br />
Tot<strong>al</strong> fertilizer consumption (t) 20,500 12,004 16,200 26,800 na na<br />
Tractors used in agric. (no.) 460 490 550 550 na na<br />
Source: FAOSTAT online database.<br />
<strong>Rice</strong> around <strong>the</strong> world 217


