Maclean et al. - 2002 - Rice almanac source book for the most important e
Maclean et al. - 2002 - Rice almanac source book for the most important e
Maclean et al. - 2002 - Rice almanac source book for the most important e
Create successful ePaper yourself
Turn your PDF publications into a flip-book with our unique Google optimized e-Paper software.
60<br />
)<br />
)<br />
<strong>Rice</strong> around <strong>the</strong> world<br />
Introduction<br />
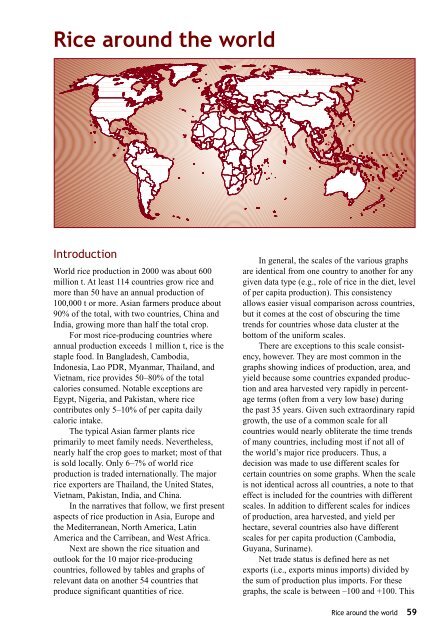
World rice production in 2000 was about 600<br />
million t. At least 114 countries grow rice and<br />
more than 50 have an annu<strong>al</strong> production of<br />
100,000 t or more. Asian farmers produce about<br />
90% of <strong>the</strong> tot<strong>al</strong>, with two countries, China and<br />
India, growing more than h<strong>al</strong>f <strong>the</strong> tot<strong>al</strong> crop.<br />
For <strong>most</strong> rice-producing countries where<br />
annu<strong>al</strong> production exceeds 1 million t, rice is <strong>the</strong><br />
staple food. In Bangladesh, Cambodia,<br />
Indonesia, Lao PDR, Myanmar, Thailand, and<br />
Vi<strong>et</strong>nam, rice provides 50–80% of <strong>the</strong> tot<strong>al</strong><br />
c<strong>al</strong>ories consumed. Notable exceptions are<br />
Egypt, Nigeria, and Pakistan, where rice<br />
contributes only 5–10% of per capita daily<br />
c<strong>al</strong>oric intake.<br />
The typic<strong>al</strong> Asian farmer plants rice<br />
primarily to me<strong>et</strong> family needs. Never<strong>the</strong>less,<br />
nearly h<strong>al</strong>f <strong>the</strong> crop goes to mark<strong>et</strong>; <strong>most</strong> of that<br />
is sold loc<strong>al</strong>ly. Only 6–7% of world rice<br />
production is traded internation<strong>al</strong>ly. The major<br />
rice exporters are Thailand, <strong>the</strong> United States,<br />
Vi<strong>et</strong>nam, Pakistan, India, and China.<br />
In <strong>the</strong> narratives that follow, we first present<br />
aspects of rice production in Asia, Europe and<br />
<strong>the</strong> Mediterranean, North America, Latin<br />
America and <strong>the</strong> Carribean, and West Africa.<br />
Next are shown <strong>the</strong> rice situation and<br />
outlook <strong>for</strong> <strong>the</strong> 10 major rice-producing<br />
countries, followed by tables and graphs of<br />
relevant data on ano<strong>the</strong>r 54 countries that<br />
produce significant quantities of rice.<br />
In gener<strong>al</strong>, <strong>the</strong> sc<strong>al</strong>es of <strong>the</strong> various graphs<br />
are identic<strong>al</strong> from one country to ano<strong>the</strong>r <strong>for</strong> any<br />
given data type (e.g., role of rice in <strong>the</strong> di<strong>et</strong>, level<br />
of per capita production). This consistency<br />
<strong>al</strong>lows easier visu<strong>al</strong> comparison across countries,<br />
but it comes at <strong>the</strong> cost of obscuring <strong>the</strong> time<br />
trends <strong>for</strong> countries whose data cluster at <strong>the</strong><br />
bottom of <strong>the</strong> uni<strong>for</strong>m sc<strong>al</strong>es.<br />
There are exceptions to this sc<strong>al</strong>e consistency,<br />
however. They are <strong>most</strong> common in <strong>the</strong><br />
graphs showing indices of production, area, and<br />
yield because some countries expanded production<br />
and area harvested very rapidly in percentage<br />
terms (often from a very low base) during<br />
<strong>the</strong> past 35 years. Given such extraordinary rapid<br />
growth, <strong>the</strong> use of a common sc<strong>al</strong>e <strong>for</strong> <strong>al</strong>l<br />
countries would nearly obliterate <strong>the</strong> time trends<br />
of many countries, including <strong>most</strong> if not <strong>al</strong>l of<br />
<strong>the</strong> world’s major rice producers. Thus, a<br />
decision was made to use different sc<strong>al</strong>es <strong>for</strong><br />
certain countries on some graphs. When <strong>the</strong> sc<strong>al</strong>e<br />
is not identic<strong>al</strong> across <strong>al</strong>l countries, a note to that<br />
effect is included <strong>for</strong> <strong>the</strong> countries with different<br />
sc<strong>al</strong>es. In addition to different sc<strong>al</strong>es <strong>for</strong> indices<br />
of production, area harvested, and yield per<br />
hectare, sever<strong>al</strong> countries <strong>al</strong>so have different<br />
sc<strong>al</strong>es <strong>for</strong> per capita production (Cambodia,<br />
Guyana, Suriname).<br />
N<strong>et</strong> trade status is defined here as n<strong>et</strong><br />
exports (i.e., exports minus imports) divided by<br />
<strong>the</strong> sum of production plus imports. For <strong>the</strong>se<br />
graphs, <strong>the</strong> sc<strong>al</strong>e is b<strong>et</strong>ween –100 and +100. This<br />
<strong>Rice</strong> around <strong>the</strong> world 59


