

PDF 20.134kB - TOBIAS-lib - Universität Tübingen
PDF 20.134kB - TOBIAS-lib - Universität Tübingen
PDF 20.134kB - TOBIAS-lib - Universität Tübingen

Sie wollen auch ein ePaper? Erhöhen Sie die Reichweite Ihrer Titel.
YUMPU macht aus Druck-PDFs automatisch weboptimierte ePaper, die Google liebt.
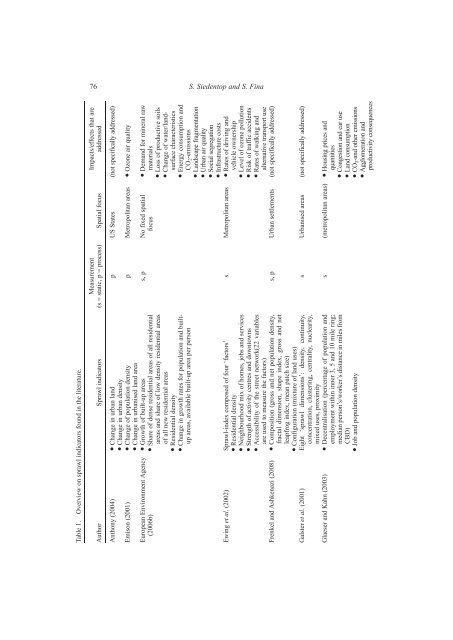
Table 1. Overview on sprawl indicators found in the literature.<br />
76 S. Siedentop and S. Fina<br />
Impacts/effects that are<br />
addressed<br />
Measurement<br />
(s = static, p = process) Spatial focus<br />
Author Sprawl indicators<br />
Anthony (2004) Change in urban land p US States (not specifically addressed)<br />
Change in urban density<br />
Emison (2001) Change of population density p Metropolitan areas Ozone air quality<br />
Demand for mineral raw<br />
materials<br />
Loss of productive soils<br />
Change of water/landsurface<br />
characteristics<br />
Energy consumption and<br />
CO2-emissions<br />
Landscape fragmentation<br />
Urban air quality<br />
Social segregation<br />
Infrastructure costs<br />
s, p No fixed spatial<br />
focus<br />
Change in urbanised land area<br />
Growth of built-up areas<br />
Share of dense residential areas of all residential<br />
areas and share of low density residential areas<br />
of all new residential areas<br />
Residential density<br />
Change in growth rates for population and builtup<br />
areas, available built-up area per person<br />
European Environment Agency<br />
(2006b)<br />
s Metropolitan areas Rates of driving and<br />
vehicle ownership<br />
Level of ozone pollution<br />
Risk of traffic accidents<br />
Rates of walking and<br />
alternative transport use<br />
s, p Urban settlements (not specifically addressed)<br />
s Urbanised areas (not specifically addressed)<br />
s (metropolitan areas) Housing prices and<br />
quantities<br />
Congestion and car use<br />
Land consumption<br />
CO2-and other emissions<br />
Agglomeration and<br />
productivity consequences<br />
Ewing et al. (2002) Sprawl-index composed of four ‘factors’<br />
Residential density<br />
Neighbourhood mix of homes, jobs and services<br />
Strength of activity centres and downtowns<br />
Accessibility of the street network(22 variables<br />
are used to measure the factors)<br />
Frenkel and Ashkenazi (2008) Composition (gross and net population density,<br />
fractal dimension, shape index, gross and net<br />
leapfrog index, mean patch size)<br />
Configuration (mixture of land uses)<br />
Galster et al. (2001) Eight ‘sprawl dimensions’: density, continuity,<br />
concentration, clustering, centrality, nuclearity,<br />
mixed uses, proximity<br />
Glaeser and Kahn (2003) Decentralisation (percentage of population and<br />
employment within inner 3, 5 and 10 mile ring;<br />
median person’s/worker’s distance in miles from<br />
CBD)<br />
Job and population density


