

PDF 20.134kB - TOBIAS-lib - Universität Tübingen
PDF 20.134kB - TOBIAS-lib - Universität Tübingen
PDF 20.134kB - TOBIAS-lib - Universität Tübingen

Erfolgreiche ePaper selbst erstellen
Machen Sie aus Ihren PDF Publikationen ein blätterbares Flipbook mit unserer einzigartigen Google optimierten e-Paper Software.
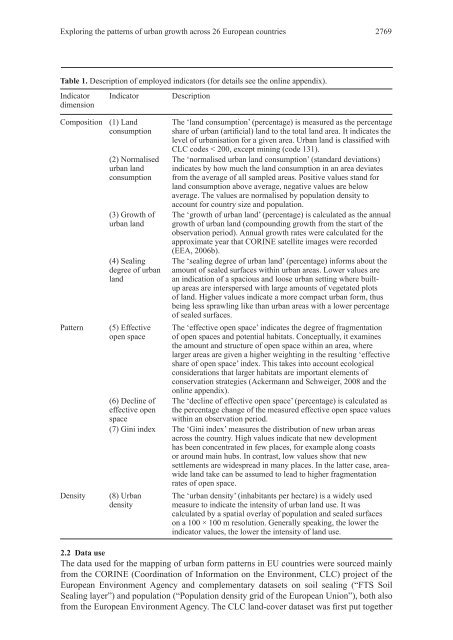
Exploring the patterns of urban growth across 26 European countries 2769<br />
Table 1. Description of employed indicators (for details see the online appendix).<br />
Indicator<br />
dimension<br />
Composition (1) Land<br />
consumption<br />
Indicator Description<br />
(2) Normalised<br />
urban land<br />
consumption<br />
(3) Growth of<br />
urban land<br />
(4) Sealing<br />
degree of urban<br />
land<br />
Pattern (5) Effective<br />
open space<br />
(6) Decline of<br />
effective open<br />
space<br />
Density (8) Urban<br />
density<br />
The ‘land consumption’ (percentage) is measured as the percentage<br />
share of urban (arti cial) land to the total land area. It indicates the<br />
level of urbanisation for a given area. Urban land is classi ed with<br />
CLC codes < 200, except mining (code 131).<br />
The ‘normalised urban land consumption’ (standard deviations)<br />
indicates by how much the land consumption in an area deviates<br />
from the average of all sampled areas. Positive values stand for<br />
land consumption above average, negative values are below<br />
average. The values are normalised by population density to<br />
account for country size and population.<br />
The ‘growth of urban land’ (percentage) is calculated as the annual<br />
growth of urban land (compounding growth from the start of the<br />
observation period). Annual growth rates were calculated for the<br />
approximate year that CORINE satellite images were recorded<br />
(EEA, 2006b).<br />
The ‘sealing degree of urban land’ (percentage) informs about the<br />
amount of sealed surfaces within urban areas. Lower values are<br />
an indication of a spacious and loose urban setting where builtup<br />
areas are interspersed with large amounts of vegetated plots<br />
of land. Higher values indicate a more compact urban form, thus<br />
being less sprawling like than urban areas with a lower percentage<br />
of sealed surfaces.<br />
The ‘effective open space’ indicates the degree of fragmentation<br />
of open spaces and potential habitats. Conceptually, it examines<br />
the amount and structure of open space within an area, where<br />
larger areas are given a higher weighting in the resulting ‘effective<br />
share of open space’ index. This takes into account ecological<br />
considerations that larger habitats are important elements of<br />
conservation strategies (Ackermann and Schweiger, 2008 and the<br />
online appendix).<br />
The ‘decline of effective open space’ (percentage) is calculated as<br />
the percentage change of the measured effective open space values<br />
within an observation period.<br />
(7) Gini index The ‘Gini index’ measures the distribution of new urban areas<br />
across the country. High values indicate that new development<br />
has been concentrated in few places, for example along coasts<br />
or around main hubs. In contrast, low values show that new<br />
settlements are widespread in many places. In the latter case, areawide<br />
land take can be assumed to lead to higher fragmentation<br />
rates of open space.<br />
The ‘urban density’ (inhabitants per hectare) is a widely used<br />
measure to indicate the intensity of urban land use. It was<br />
calculated by a spatial overlay of population and sealed surfaces<br />
on a 100 × 100 m resolution. Generally speaking, the lower the<br />
indicator values, the lower the intensity of land use.<br />
2.2 Data use<br />
The data used for the mapping of urban form patterns in EU countries were sourced mainly<br />
from the CORINE (Coordination of Information on the Environment, CLC) project of the<br />
European Environment Agency and complementary datasets on soil sealing (“FTS Soil<br />
Sealing layer”) and population (“Population density grid of the European Union”), both also<br />
from the European Environment Agency. The CLC land-cover dataset was rst put together


