

PDF 20.134kB - TOBIAS-lib - Universität Tübingen
PDF 20.134kB - TOBIAS-lib - Universität Tübingen
PDF 20.134kB - TOBIAS-lib - Universität Tübingen

Sie wollen auch ein ePaper? Erhöhen Sie die Reichweite Ihrer Titel.
YUMPU macht aus Druck-PDFs automatisch weboptimierte ePaper, die Google liebt.
2772 S Siedentop, S Fina<br />
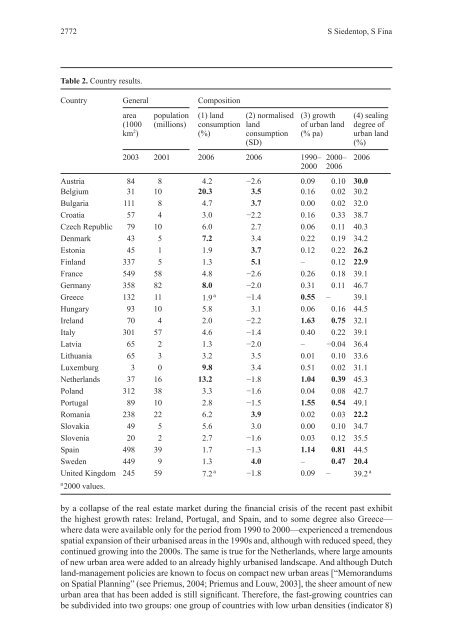
Table 2. Country results.<br />
Country General Composition<br />
area<br />
(1000<br />
km 2 )<br />
population<br />
(millions)<br />
(1) land<br />
consumption<br />
(%)<br />
(2) normalised<br />
land<br />
consumption<br />
(SD)<br />
2003 2001 2006 2006 1990–<br />
2000<br />
(3) growth<br />
of urban land<br />
(% pa)<br />
2000–<br />
2006<br />
(4) sealing<br />
degree of<br />
urban land<br />
(%)<br />
by a collapse of the real estate market during the nancial crisis of the recent past exhibit<br />
the highest growth rates: Ireland, Portugal, and Spain, and to some degree also Greece—<br />
where data were available only for the period from 1990 to 2000—experienced a tremendous<br />
spatial expansion of their urbanised areas in the 1990s and, although with reduced speed, they<br />
continued growing into the 2000s. The same is true for the Netherlands, where large amounts<br />
of new urban area were added to an already highly urbanised landscape. And although Dutch<br />
land-management policies are known to focus on compact new urban areas [“Memorandums<br />
on Spatial Planning” (see Priemus, 2004; Priemus and Louw, 2003], the sheer amount of new<br />
urban area that has been added is still signi cant. Therefore, the fast-growing countries can<br />
be subdivided into two groups: one group of countries with low urban densities (indicator 8)<br />
2006<br />
Austria 84. 8. 4.2 2.6 0.09 0.10 30.0<br />
Belgium 31. 10. 20.3 3.5 0.16 0.02 30.2<br />
Bulgaria 111. 8. 4.7 3.7 0.00 0.02 32.0<br />
Croatia 57. 4. 3.0 2.2 0.16 0.33 38.7<br />
Czech Republic 79. 10. 6.0 2.7 0.06 0.11 40.3<br />
Denmark 43. 5. 7.2 3.4 0.22 0.19 34.2<br />
Estonia 45. 1. 1.9 3.7 0.12 0.22 26.2<br />
Finland 337. 5. 1.3 5.1 – 0.12 22.9<br />
France 549. 58. 4.8 2.6 0.26 0.18 39.1<br />
Germany 358. 82. 8.0 2.0 0.31 0.11 46.7<br />
Greece 132. 11. 1.9 a 1.4 0.55 – 39.1<br />
Hungary 93. 10. 5.8 3.1 0.06 0.16 44.5<br />
Ireland 70. 4. 2.0 2.2 1.63 0.75 32.1<br />
Italy 301. 57. 4.6 1.4 0.40 0.22 39.1<br />
Latvia 65. 2. 1.3 2.0 – 0.04 36.4<br />
Lithuania 65. 3. 3.2 3.5 0.01 0.10 33.6<br />
Luxemburg 3. 0. 9.8 3.4 0.51 0.02 31.1<br />
Netherlands 37. 16. 13.2 1.8 1.04 0.39 45.3<br />
Poland 312. 38. 3.3 1.6 0.04 0.08 42.7<br />
Portugal 89. 10. 2.8 1.5 1.55 0.54 49.1<br />
Romania 238. 22. 6.2 3.9 0.02 0.03 22.2<br />
Slovakia 49. 5. 5.6 3.0 0.00 0.10 34.7<br />
Slovenia 20. 2. 2.7 1.6 0.03 0.12 35.5<br />
Spain 498. 39. 1.7 1.3 1.14 0.81 44.5<br />
Sweden 449. 9. 1.3 4.0 – 0.47 20.4<br />
United Kingdom 245. 59. 7.2 a 1.8 0.09 – 39.2 a<br />
a 2000 values.


