- Seite 1 und 2:
Indikatoren der Raumentwicklung Fl
- Seite 4 und 5:
Kurzdarstellung Die Begrenzung und
- Seite 6 und 7:
Inhaltsverzeichnis 1 Problemstellun
- Seite 8 und 9:
ANHANG A Anhang A-1: Mindestveröff
- Seite 10 und 11:
1 Problemstellung und Inhalt Die Fl
- Seite 12 und 13:
erschließen, und bewegt sich damit
- Seite 14 und 15:
die Verfahren zur Erhebung flächen
- Seite 16 und 17:
Auch ohne Einbeziehung von Wirkungs
- Seite 18 und 19:
S.57) erlebten, meinten damit die m
- Seite 20 und 21:
Density Continuity Concentration Cl
- Seite 22 und 23:
nahme im Land gibt (Rat für Nachha
- Seite 24 und 25:
und im Baugesetzbuch (BauGB), aber
- Seite 26 und 27:
obachtung, die seit 1965 im gesetzl
- Seite 28 und 29:
Ein weiterer Kritikpunkt an der Ver
- Seite 30 und 31:
ungen spielt keine oder eine eher u
- Seite 32 und 33:
ungen des Gesetzgebers, die Fläche
- Seite 34 und 35:
Im Bereich der Flächenentwicklung
- Seite 36 und 37:
tung gängiger Monitoringansätze,
- Seite 38 und 39:
grafischen Wandels zukünftig aber
- Seite 40 und 41:
2.3 Forschungsbedarf und Zielsetzun
- Seite 42 und 43:
3 Publikationsbasierte Ergebnisse I
- Seite 44 und 45:
den verschiedenen Motivationen (soz
- Seite 46 und 47:
wieder Hinweise auf kompakte Siedlu
- Seite 48 und 49:
me nicht zur Zersiedelung beitragen
- Seite 50 und 51:
dritte Teil beschäftigt sich mit d
- Seite 52 und 53:
Flächeninanspruchnahme räumlich u
- Seite 54 und 55:
3.4 Triebkräfte der Flächeninansp
- Seite 56 und 57:
Privathaushalte gesamt Zweipersonen
- Seite 58 und 59:
en. Gleichzeitig verbleibt wenig fi
- Seite 60 und 61:
Schlüsselpublikation des Autors zu
- Seite 62 und 63:
zwangsläufig deren Landschaftsqual
- Seite 64 und 65:
Darüber hinaus ist die Nachnutzung
- Seite 66 und 67:
äumliche Bewertung bebaubarer Flä
- Seite 68 und 69:
Württemberg bewertet und damit die
- Seite 70 und 71:
Flächenabzugsverfahren der Bauland
- Seite 72 und 73:
Eine klar zu benennende Lücke ist
- Seite 74 und 75:
Darüber hinaus wird die Datenberei
- Seite 76 und 77:
die Befürchtung von Repressalien i
- Seite 78 und 79:
edarf es einer diskursiven Planungs
- Seite 80 und 81:
BOCK, S., HINZEN, A. & LIBBE, J. (H
- Seite 82 und 83:
EUROPEAN ENVIRONMENT AGENCY 2006. U
- Seite 84 und 85:
unter: http://www.ggr-planung.de/fi
- Seite 86 und 87:
Siedlungsentwicklung in Baden-Würt
- Seite 88 und 89:
aus der REFINA-Forschung Reihe REFI
- Seite 90 und 91:
SIEDENTOP, S., HEILAND, S., LEHMANN
- Seite 92 und 93:
Anhang A Nutzungsartengruppe Gebäu
- Seite 94:
Indikatoren und Messgrößen Potent
- Seite 97 und 98:
Proceedings REAL CORP 2011 Tagungsb
- Seite 99 und 100:
Proceedings REAL CORP 2011 Tagungsb
- Seite 101 und 102: Proceedings REAL CORP 2011 Tagungsb
- Seite 103 und 104: Proceedings REAL CORP 2011 Tagungsb
- Seite 105 und 106: Proceedings REAL CORP 2011 Tagungsb
- Seite 107 und 108: Proceedings REAL CORP 2011 Tagungsb
- Seite 109 und 110: Journal of Land Use Science Vol. 5,
- Seite 111 und 112: Journal of Land Use Science 75 comp
- Seite 113 und 114: s (urban) regions (not specifically
- Seite 115 und 116: Landscape fragmentation Pattern-rel
- Seite 117 und 118: Table 3. Selected sprawl indicators
- Seite 119 und 120: 5 6−10 11−15 16−30 31−55 <
- Seite 121 und 122: 25 26-50 51-100 101-150 Indicator 9
- Seite 123 und 124: Journal of Land Use Science 87 info
- Seite 125 und 126: Journal of Land Use Science 89 (lik
- Seite 127 und 128: Journal of Land Use Science 91 pre-
- Seite 129 und 130: stood out in the resulting dendrogr
- Seite 131 und 132: Journal of Land Use Science 95 5.3.
- Seite 133 und 134: Journal of Land Use Science 97 Arno
- Seite 135 und 136: Journal of Land Use Science 99 Mein
- Seite 137 und 138: Annex 1. (Continued) Formula P Pt P
- Seite 139 und 140: Annex 1. (Continued) Indicator 7 Op
- Seite 141 und 142: ANHANG B-3: FINA, S. eingereicht Ju
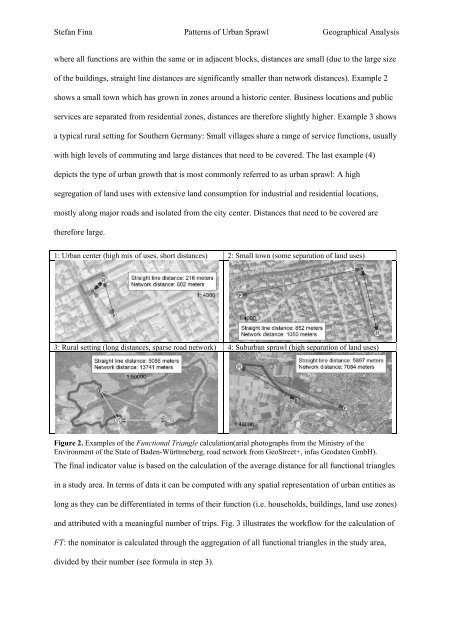
- Seite 143 und 144: Stefan Fina Patterns of Urban Spraw
- Seite 145 und 146: Stefan Fina Patterns of Urban Spraw
- Seite 147 und 148: Stefan Fina Patterns of Urban Spraw
- Seite 149 und 150: Stefan Fina Patterns of Urban Spraw
- Seite 151: Stefan Fina Patterns of Urban Spraw
- Seite 155 und 156: Stefan Fina Patterns of Urban Spraw
- Seite 157 und 158: Stefan Fina Patterns of Urban Spraw
- Seite 159 und 160: Stefan Fina Patterns of Urban Spraw
- Seite 176 und 177: ANHANG B-5: SIEDENTOP, S. & FINA, S
- Seite 178 und 179: 2766 S Siedentop, S Fina dispersed
- Seite 180 und 181: 2768 S Siedentop, S Fina With these
- Seite 182 und 183: 2770 S Siedentop, S Fina for the ye
- Seite 184 und 185: 2772 S Siedentop, S Fina Table 2. C
- Seite 186 und 187: 2774 S Siedentop, S Fina Consumptio
- Seite 188 und 189: 2776 S Siedentop, S Fina table 2 an
- Seite 190 und 191: 2778 S Siedentop, S Fina Table 2 sh
- Seite 192 und 193: 2780 S Siedentop, S Fina Urban area
- Seite 194 und 195: 2782 S Siedentop, S Fina context we
- Seite 196 und 197: 2784 S Siedentop, S Fina Schneider
- Seite 198 und 199: 2 Europa Regional 17(2009)1
- Seite 200 und 201: 4 Europa Regional 17(2009)1
- Seite 202 und 203:
Indicator development for risk asse
- Seite 204 und 205:
Data source: State Office of Statis
- Seite 206 und 207:
4 Parents whose children have moved
- Seite 208 und 209:
Data source: derived from data sour
- Seite 210 und 211:
Dipl.-Geogr. STEFAN FINA Dipl.-Ing.
- Seite 212 und 213:
Flächenverbrauch und Landschaftsze
- Seite 214 und 215:
Flächenverbrauch und Landschaftsze
- Seite 216 und 217:
Flächenverbrauch und Landschaftsze
- Seite 218 und 219:
Flächenverbrauch und Landschaftsze
- Seite 220 und 221:
Flächenverbrauch und Landschaftsze
- Seite 222 und 223:
Flächenverbrauch und Landschaftsze
- Seite 224 und 225:
LAND USE ECONOMICS AND PLANNING - D
- Seite 226 und 227:
Steuerung der Siedlungs- und Verkeh
- Seite 228 und 229:
Gliederung 1. Einführung .........
- Seite 230 und 231:
was bislang aber nach Kenntnis der
- Seite 232 und 233:
wahlweise auf die systematische Ide
- Seite 234 und 235:
Flächen mit mehr als 15% Hangneigu
- Seite 236 und 237:
- Regionales Raumordnungsprogramm H
- Seite 238 und 239:
sehr geringes Baulandpotenzial von
- Seite 240 und 241:
Region Hannover ist der durch Vorra
- Seite 242 und 243:
3.5 Regionsübergreifende Wertung T
- Seite 244 und 245:
Abb. 2: „Tabuflächen“ in den M
- Seite 246 und 247:
schutz - fast ein Viertel der Gesam
- Seite 248 und 249:
gedeckt ist. Die vollständige Auss
- Seite 250 und 251:
Literatur Bergfeld, A., Groß, I.-B
- Seite 252 und 253:
Siedentop, S., Kausch, S. (2004): D
- Seite 254 und 255:
Tabelle A3: Tabuflächenkategorien
- Seite 256 und 257:
Tabelle A7: Tabuflächenkategorien
- Seite 258 und 259:
Tabelle B1: Ausgewählte Gemeindeer
- Seite 260 und 261:
Gemeinde Tabelle B3: Ausgewählte G
- Seite 262 und 263:
Tabelle B3: Ausgewählte Gemeindeer
- Seite 264 und 265:
Tabelle B4: Ausgewählte Gemeindeer
- Seite 266 und 267:
Tabelle B4: Ausgewählte Gemeindeer