We build business networks and relationships ... - skupina kd group
We build business networks and relationships ... - skupina kd group
We build business networks and relationships ... - skupina kd group

You also want an ePaper? Increase the reach of your titles
YUMPU automatically turns print PDFs into web optimized ePapers that Google loves.
KD Holding Group<br />
Notes to Consolidated Financial Statements as at <strong>and</strong> for the year ended 31 December 2007<br />
multiplying the number of reported damages in 2006<br />
b) Changes of assumptions<br />
by the average factor of damages reported later in<br />
relation to all reported damages over the past three<br />
years. The estimated value of IBNR damages equals<br />
There were no changes of assumptions for<br />
insurance contracts in 2007 according to 2006.<br />
the average value of IBRN damages in the past year<br />
or the average value of damages paid in the past year<br />
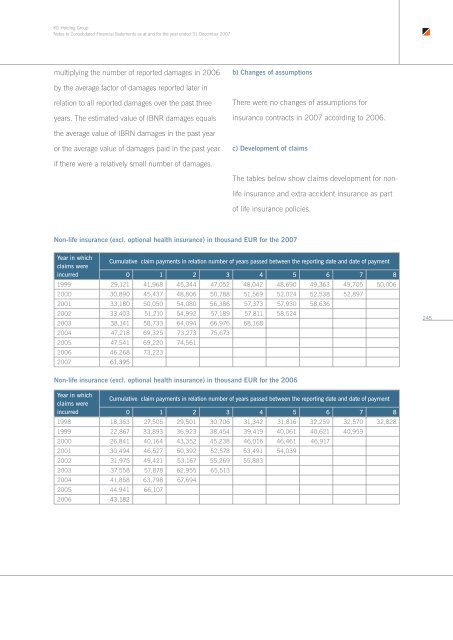
c) Development of claims<br />
if there were a relatively small number of damages.<br />
The tables below show claims development for nonlife<br />
insurance <strong>and</strong> extra accident insurance as part<br />
of life insurance policies.<br />
Non-life insurance (excl. optional health insurance) in thous<strong>and</strong> EUR for the 2007<br />
Year in which<br />
claims were<br />
Cumulative claim payments in relation number of years passed between the reporting date <strong>and</strong> date of payment<br />
incurred<br />
0 1 2 3 4 5 6 7 8<br />
1999 29,121 41,968 45,344 47,052 48,042 48,690 49,363 49,705 50,006<br />
2000 30,890 45,437 48,806 50,788 51,569 52,024 52,538 52,897<br />
2001 33,180 50,050 54,080 56,386 57,373 57,930 58,636<br />
2002 33,403 51,210 54,992 57,189 57,811 58,524<br />
2003 38,141 58,733 64,094 66,976 68,168<br />
2004 47,218 69,325 73,273 75,673<br />
2005 47,541 69,220 74,561<br />
2006 46,268 73,223<br />
2007 61,395<br />
245<br />
Non-life insurance (excl. optional health insurance) in thous<strong>and</strong> EUR for the 2006<br />
Year in which<br />
claims were<br />
Cumulative claim payments in relation number of years passed between the reporting date <strong>and</strong> date of payment<br />
incurred<br />
0 1 2 3 4 5 6 7 8<br />
1998 18,363 27,505 29,501 30,706 31,342 31,816 32,259 32,570 32,828<br />
1999 22,867 33,893 36,923 38,454 39,419 40,061 40,621 40,959<br />
2000 26,841 40,164 43,352 45,238 46,016 46,461 46,917<br />
2001 30,494 46,527 50,392 52,578 53,491 54,039<br />
2002 31,975 49,421 53,167 55,269 55,883<br />
2003 37,558 57,878 62,955 65,513<br />
2004 41,858 63,798 67,694<br />
2005 44,941 66,107<br />
2006 43,182