We build business networks and relationships ... - skupina kd group
We build business networks and relationships ... - skupina kd group
We build business networks and relationships ... - skupina kd group

Create successful ePaper yourself
Turn your PDF publications into a flip-book with our unique Google optimized e-Paper software.
KD Holding Group<br />
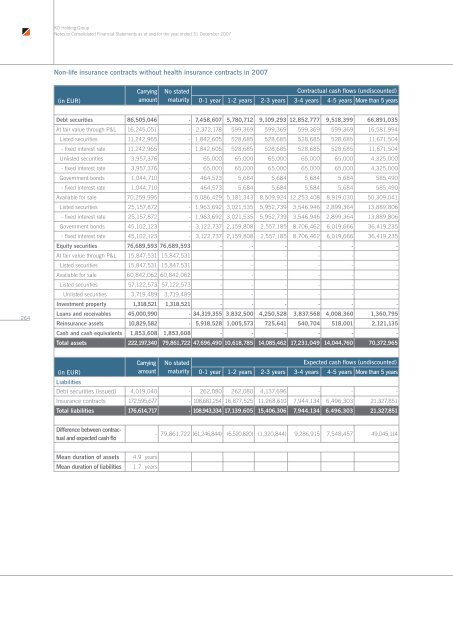
Notes to Consolidated Financial Statements as at <strong>and</strong> for the year ended 31 December 2007<br />
Non-life insurance contracts without health insurance contracts in 2007<br />
(in EUR)<br />
Carrying<br />
amount<br />
No stated<br />
maturity<br />
Contractual cash flows (undiscounted)<br />
0-1 year 1-2 years 2-3 years 3-4 years 4-5 years More than 5 years<br />
264<br />
Debt securities 86,505,046 - 7,458,607 5,780,712 9,109,293 12,852,777 9,518,399 66,891,035<br />
At fair value through P&L 16,245,051 - 2,372,178 599,369 599,369 599,369 599,369 16,581,994<br />
Listed securities 11,242,965 - 1,842,605 528,685 528,685 528,685 528,685 11,671,504<br />
- fixed interest rate 11,242,965 - 1,842,605 528,685 528,685 528,685 528,685 11,671,504<br />
Unlisted securities 3,957,376 - 65,000 65,000 65,000 65,000 65,000 4,325,000<br />
- fixed interest rate 3,957,376 - 65,000 65,000 65,000 65,000 65,000 4,325,000<br />
Government bonds 1,044,710 - 464,573 5,684 5,684 5,684 5,684 585,490<br />
- fixed interest rate 1,044,710 - 464,573 5,684 5,684 5,684 5,684 585,490<br />
Available for sale 70,259,995 - 5,086,429 5,181,343 8,509,924 12,253,408 8,919,030 50,309,041<br />
Listed securities 25,157,872 - 1,963,692 3,021,535 5,952,739 3,546,946 2,899,364 13,889,806<br />
- fixed interest rate 25,157,872 - 1,963,692 3,021,535 5,952,739 3,546,946 2,899,364 13,889,806<br />
Government bonds 45,102,123 - 3,122,737 2,159,808 2,557,185 8,706,462 6,019,666 36,419,235<br />
- fixed interest rate 45,102,123 - 3,122,737 2,159,808 2,557,185 8,706,462 6,019,666 36,419,235<br />
Equity securities 76,689,593 76,689,593 - - - - - -<br />
At fair value through P&L 15,847,531 15,847,531 - - - - - -<br />
Listed securities 15,847,531 15,847,531 - - - - - -<br />
Available for sale 60,842,062 60,842,062 - - - - - -<br />
Listed securities 57,122,573 57,122,573 - - - - - -<br />
Unlisted securities 3,719,489 3,719,489 - - - - - -<br />
Investment property 1,318,521 1,318,521 - - - - - -<br />
Loans <strong>and</strong> receivables 45,000,990 - 34,319,355 3,832,500 4,250,528 3,837,568 4,008,360 1,360,795<br />
Reinsurance assets 10,829,582 - 5,918,528 1,005,573 725,641 540,704 518,001 2,121,135<br />
Cash <strong>and</strong> cash equivalents 1,853,608 1,853,608 - - - - - -<br />
Total assets 222,197,340 79,861,722 47,696,490 10,618,785 14,085,462 17,231,049 14,044,760 70,372,965<br />
Carrying No stated<br />
Expected cash flows (undiscounted)<br />
(in EUR)<br />
amount maturity 0-1 year 1-2 years 2-3 years 3-4 years 4-5 years More than 5 years<br />
Liabilities<br />
Debt securities (issued) 4,019,040 - 262,080 262,080 4,137,696 - - -<br />
Insurance contracts 172,595,677 - 108,681,254 16,877,525 11,268,610 7,944,134 6,496,303 21,327,851<br />
Total liabilities 176,614,717 - 108,943,334 17,139,605 15,406,306 7,944,134 6,496,303 21,327,851<br />
Difference between contractual<br />
<strong>and</strong> expected cash flo<br />
- 79,861,722 (61,246,844) (6,520,820) (1,320,844) 9,286,915 7,548,457 49,045,114<br />
Mean duration of assets<br />
Mean duration of liabilities<br />
4.9 years<br />
1.7 years