We build business networks and relationships ... - skupina kd group
We build business networks and relationships ... - skupina kd group
We build business networks and relationships ... - skupina kd group

You also want an ePaper? Increase the reach of your titles
YUMPU automatically turns print PDFs into web optimized ePapers that Google loves.
KD Holding Group<br />
Notes to Consolidated Financial Statements as at <strong>and</strong> for the year ended 31 December 2007<br />
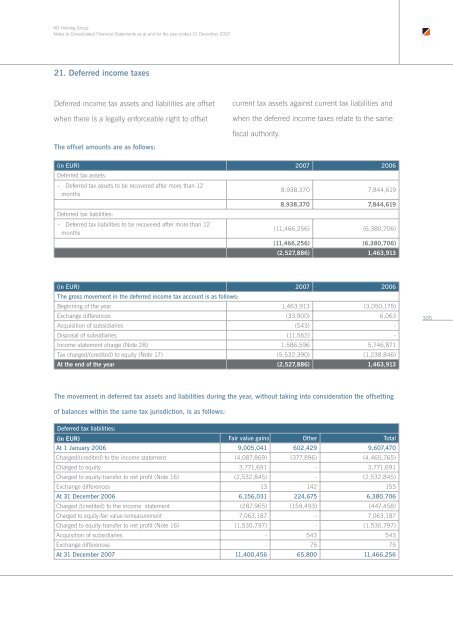
21. Deferred income taxes<br />
Deferred income tax assets <strong>and</strong> liabilities are offset<br />
when there is a legally enforceable right to offset<br />
current tax assets against current tax liabilities <strong>and</strong><br />
when the deferred income taxes relate to the same<br />
fiscal authority.<br />
The offset amounts are as follows:<br />
(in EUR) 2007 2006<br />
Deferred tax assets:<br />
– Deferred tax assets to be recovered after more than 12<br />
months<br />
8,938,370 7,844,619<br />
8,938,370 7,844,619<br />
Deferred tax liabilities:<br />
– Deferred tax liabilities to be recovered after more than 12<br />
months<br />
(11,466,256) (6,380,706)<br />
(11,466,256) (6,380,706)<br />
(2,527,886) 1,463,913<br />
(in EUR) 2007 2006<br />
The gross movement in the deferred income tax account is as follows:<br />
Beginning of the year 1,463,913 (3,050,175)<br />
Exchange differences (33,900) 6,063<br />
Acquisition of subsidiaries (543) -<br />
Disposal of subsidiaries (11,562) -<br />
Income statement charge (Note 28) 1,586,596 5,746,871<br />
Tax charged/(credited) to equity (Note 17) (5,532,390) (1,238,846)<br />
At the end of the year (2,527,886) 1,463,913<br />
305<br />
The movement in deferred tax assets <strong>and</strong> liabilities during the year, without taking into consideration the offsetting<br />
of balances within the same tax jurisdiction, is as follows:<br />
Deferred tax liabilities:<br />
(in EUR) Fair value gains Other Total<br />
At 1 January 2006 9,005,041 602,429 9,607,470<br />
Charged/(credited) to the income statement (4,087,869) (377,896) (4,465,765)<br />
Charged to equity 3,771,691 - 3,771,691<br />
Charged to equity-transfer to net profit (Note 16) (2,532,845) - (2,532,845)<br />
Exchange differences 13 142 155<br />
At 31 December 2006 6,156,031 224,675 6,380,706<br />
Charged /(credited) to the income statement (287,965) (159,493) (447,458)<br />
Charged to equity-fair value remeasurement 7,063,187 - 7,063,187<br />
Charged to equity-transfer to net profit (Note 16) (1,530,797) - (1,530,797)<br />
Acquisition of subsidiaries - 543 543<br />
Exchange differences - 75 75<br />
At 31 December 2007 11,400,456 65,800 11,466,256