We build business networks and relationships ... - skupina kd group
We build business networks and relationships ... - skupina kd group
We build business networks and relationships ... - skupina kd group

Create successful ePaper yourself
Turn your PDF publications into a flip-book with our unique Google optimized e-Paper software.
KD Holding Group<br />
Notes to Consolidated Financial Statements as at <strong>and</strong> for the year ended 31 December 2007<br />
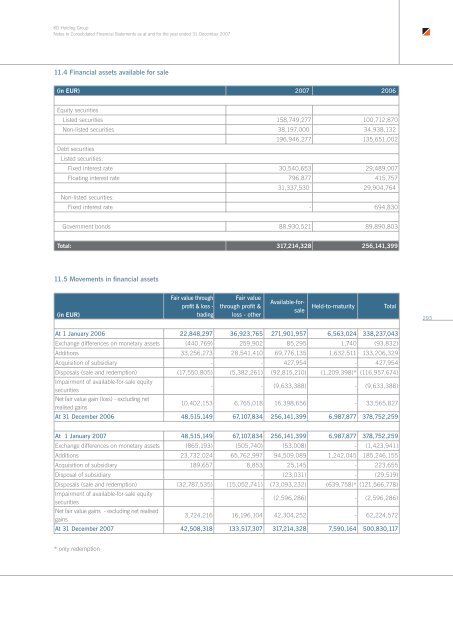
11.4 Financial assets available for sale<br />
(in EUR) 2007 2006<br />
Equity securities<br />
Listed securities 158,749,277 100,712,870<br />
Non-listed securities 38,197,000 34,938,132<br />
196,946,277 135,651,002<br />
Debt securities<br />
Listed securities:<br />
Fixed interest rate 30,540,653 29,489,007<br />
Floating interest rate 796,877 415,757<br />
31,337,530 29,904,764<br />
Non-listed securities:<br />
Fixed interest rate - 694,830<br />
Government bonds 88,930,521 89,890,803<br />
Total: 317,214,328 256,141,399<br />
11.5 Movements in financial assets<br />
(in EUR)<br />
Fair value through<br />
profit & loss -<br />
trading<br />
Fair value<br />
through profit &<br />
loss - other<br />
Available-forsale<br />
Held-to-maturity<br />
Total<br />
293<br />
At 1 January 2006 22,848,297 36,923,765 271,901,957 6,563,024 338,237,043<br />
Exchange differences on monetary assets (440,769) 259,902 85,295 1,740 (93,832)<br />
Additions 33,256,273 28,541,410 69,776,135 1,632,511 133,206,329<br />
Acquisition of subsidiary - - 427,954 - 427,954<br />
Disposals (sale <strong>and</strong> redemption) (17,550,805) (5,382,261) (92,815,210) (1,209,398)* (116,957,674)<br />
Impairment of available-for-sale equity<br />
securities<br />
- - (9,633,388) - (9,633,388)<br />
Net fair value gain (loss) - excluding net<br />
realised gains<br />
10,402,153 6,765,018 16,398,656 - 33,565,827<br />
At 31 December 2006 48,515,149 67,107,834 256,141,399 6,987,877 378,752,259<br />
At 1 January 2007 48,515,149 67,107,834 256,141,399 6,987,877 378,752,259<br />
Exchange differences on monetary assets (865,193) (505,740) (53,008) - (1,423,941)<br />
Additions 23,732,024 65,762,997 94,509,089 1,242,045 185,246,155<br />
Acquisition of subsidiary 189,657 8,853 25,145 - 223,655<br />
Disposal of subsidiary - - (23,031) - (29,519)<br />
Disposals (sale <strong>and</strong> redemption) (32,787,535) (15,052,741) (73,093,232) (639,758)* (121,566,778)<br />
Impairment of available-for-sale equity<br />
securities<br />
- - (2,596,286) - (2,596,286)<br />
Net fair value gains - excluding net realised<br />
gains<br />
3,724,216 16,196,104 42,304,252 - 62,224,572<br />
At 31 December 2007 42,508,318 133,517,307 317,214,328 7,590,164 500,830,117<br />
* only redemption