

Review of 2010 â USD version - Skanska
Review of 2010 â USD version - Skanska
Review of 2010 â USD version - Skanska

Create successful ePaper yourself
Turn your PDF publications into a flip-book with our unique Google optimized e-Paper software.
Note<br />
03 Continued<br />
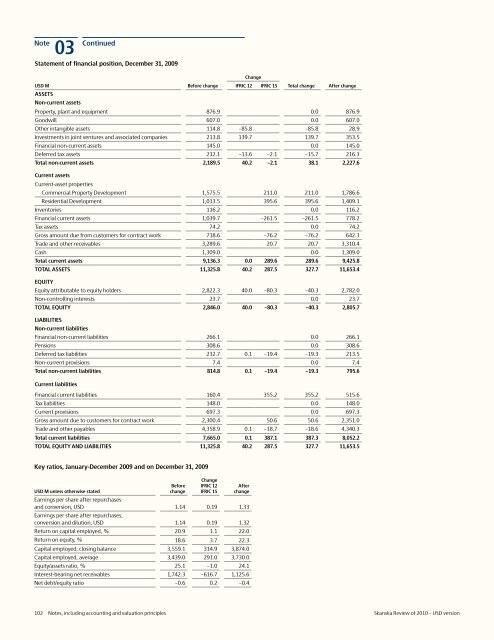
Statement <strong>of</strong> financial position, December 31, 2009<br />
Change<br />
<strong>USD</strong> M Before change IFRIC 12 IFRIC 15 Total change After change<br />
ASSETS<br />
Non-current assets<br />
Property, plant and equipment 876.9 0.0 876.9<br />
Goodwill 607.0 0.0 607.0<br />
Other intangible assets 114.8 –85.8 –85.8 28.9<br />
Investments in joint ventures and associated companies 213.8 139.7 139.7 353.5<br />
Financial non-current assets 145.0 0.0 145.0<br />
Deferred tax assets 232.1 –13.6 –2.1 –15.7 216.3<br />
Total non-current assets 2,189.5 40.2 –2.1 38.1 2,227.6<br />
Current assets<br />
Current-asset properties<br />
Commercial Property Development 1,575.5 211.0 211.0 1,786.6<br />
Residential Development 1,013.5 395.6 395.6 1,409.1<br />
Inventories 116.2 0.0 116.2<br />
Financial current assets 1,039.7 –261.5 –261.5 778.2<br />
Tax assets 74.2 0.0 74.2<br />
Gross amount due from customers for contract work 718.6 –76.2 –76.2 642.3<br />
Trade and other receivables 3,289.6 20.7 20.7 3,310.4<br />
Cash 1,309.0 0.0 1,309.0<br />
Total current assets 9,136.3 0.0 289.6 289.6 9,425.8<br />
TOTAL ASSETS 11,325.8 40.2 287.5 327.7 11,653.4<br />
EQUITY<br />
Equity attributable to equity holders 2,822.3 40.0 –80.3 –40.3 2,782.0<br />
Non-controlling interests 23.7 0.0 23.7<br />
TOTAL EQUITY 2,846.0 40.0 –80.3 –40.3 2,805.7<br />
LIABILITIES<br />
Non-current liabilities<br />
Financial non-current liabilities 266.1 0.0 266.1<br />
Pensions 308.6 0.0 308.6<br />
Deferred tax liabilities 232.7 0.1 –19.4 –19.3 213.5<br />
Non-current provisions 7.4 0.0 7.4<br />
Total non-current liabilities 814.8 0.1 –19.4 –19.3 795.6<br />
Current liabilities<br />
Financial current liabilities 160.4 355.2 355.2 515.6<br />
Tax liabilities 148.0 0.0 148.0<br />
Current provisions 697.3 0.0 697.3<br />
Gross amount due to customers for contract work 2,300.4 50.6 50.6 2,351.0<br />
Trade and other payables 4,358.9 0.1 –18.7 –18.6 4,340.3<br />
Total current liabilities 7,665.0 0.1 387.1 387.3 8,052.2<br />
TOTAL EQUITY AND LIABILITIES 11,325.8 40.2 287.5 327.7 11,653.5<br />
Key ratios, January-December 2009 and on December 31, 2009<br />
<strong>USD</strong> M unless otherwise stated<br />
Before<br />
change<br />
Change<br />
IFRIC 12<br />
IFRIC 15<br />
After<br />
change<br />
Earnings per share after repurchases<br />
and con<strong>version</strong>, <strong>USD</strong> 1.14 0.19 1.33<br />
Earnings per share after repurchases,<br />
con<strong>version</strong> and dilution, <strong>USD</strong> 1.14 0.19 1.32<br />
Return on capital employed, % 20.9 1.1 22.0<br />
Return on equity, % 18.6 3.7 22.3<br />
Capital employed, closing balance 3,559.1 314.9 3,874.0<br />
Capital employed, average 3,439.0 291.0 3,730.0<br />
Equity/assets ratio, % 25.1 –1.0 24.1<br />
Interest-bearing net receivables 1,742.3 –616.7 1,125.6<br />
Net debt/equity ratio –0.6 0.2 –0.4<br />
102 Notes, including accounting and valuation principles <strong>Skanska</strong> <strong>Review</strong> <strong>of</strong> <strong>2010</strong> – <strong>USD</strong> <strong>version</strong>


