

Review of 2010 â USD version - Skanska
Review of 2010 â USD version - Skanska
Review of 2010 â USD version - Skanska

You also want an ePaper? Increase the reach of your titles
YUMPU automatically turns print PDFs into web optimized ePapers that Google loves.
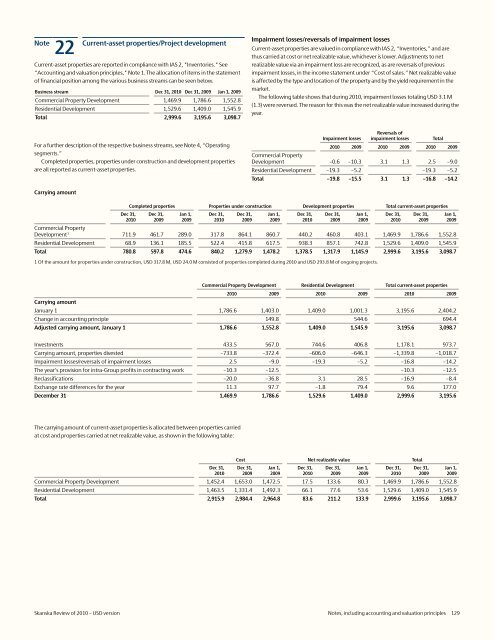
Note<br />
22<br />
Current-asset properties/Project development<br />
Current-asset properties are reported in compliance with IAS 2, "Inventories." See<br />
"Accounting and valuation principles," Note 1. The allocation <strong>of</strong> items in the statement<br />
<strong>of</strong> financial position among the various business streams can be seen below.<br />
Business stream Dec 31, <strong>2010</strong> Dec 31, 2009 Jan 1, 2009<br />
Commercial Property Development 1,469.9 1,786.6 1,552.8<br />
Residential Development 1,529.6 1,409.0 1,545.9<br />
Total 2,999.6 3,195.6 3,098.7<br />
Impairment losses/reversals <strong>of</strong> impairment losses<br />
Current-asset properties are valued in compliance with IAS 2, “Inventories,” and are<br />
thus carried at cost or net realizable value, whichever is lower. Adjustments to net<br />
realizable value via an impairment loss are recognized, as are reversals <strong>of</strong> previous<br />
impairment losses, in the income statement under “Cost <strong>of</strong> sales.” Net realizable value<br />
is affected by the type and location <strong>of</strong> the property and by the yield requirement in the<br />
market.<br />
The following table shows that during <strong>2010</strong>, impairment losses totaling <strong>USD</strong> 3.1 M<br />
(1.3) were reversed. The reason for this was the net realizable value increased during the<br />
year.<br />
For a further description <strong>of</strong> the respective business streams, see Note 4, “Operating<br />
segments.”<br />
Completed properties, properties under construction and development properties<br />
are all reported as current-asset properties.<br />
Impairment losses<br />
Reversals <strong>of</strong><br />
impairment losses<br />
Total<br />
<strong>2010</strong> 2009 <strong>2010</strong> 2009 <strong>2010</strong> 2009<br />
Commercial Property<br />
Development –0.6 –10.3 3.1 1.3 2.5 –9.0<br />
Residential Development –19.3 –5.2 –19.3 –5.2<br />
Total –19.8 –15.5 3.1 1.3 –16.8 –14.2<br />
Carrying amount<br />
Completed properties Properties under construction Development properties Total current-asset properties<br />
Dec 31,<br />
<strong>2010</strong><br />
Dec 31,<br />
2009<br />
Jan 1,<br />
2009<br />
Dec 31,<br />
<strong>2010</strong><br />
Dec 31,<br />
2009<br />
Commercial Property<br />
Development 1 711.9 461.7 289.0 317.8 864.1 860.7 440.2 460.8 403.1 1,469.9 1,786.6 1,552.8<br />
Residential Development 68.9 136.1 185.5 522.4 415.8 617.5 938.3 857.1 742.8 1,529.6 1,409.0 1,545.9<br />
Total 780.8 597.8 474.6 840.2 1,279.9 1,478.2 1,378.5 1,317.9 1,145.9 2,999.6 3,195.6 3,098.7<br />
1 Of the amount for properties under construction, <strong>USD</strong> 317.8 M, <strong>USD</strong> 24.0 M consisted <strong>of</strong> properties completed during <strong>2010</strong> and <strong>USD</strong> 293.8 M <strong>of</strong> ongoing projects.<br />
Jan 1,<br />
2009<br />
Dec 31,<br />
<strong>2010</strong><br />
Dec 31,<br />
2009<br />
Jan 1,<br />
2009<br />
Dec 31,<br />
<strong>2010</strong><br />
Dec 31,<br />
2009<br />
Jan 1,<br />
2009<br />
Commercial Property Development Residential Development Total current-asset properties<br />
<strong>2010</strong> 2009 <strong>2010</strong> 2009 <strong>2010</strong> 2009<br />
Carrying amount<br />
January 1 1,786.6 1,403.0 1,409.0 1,001.3 3,195.6 2,404.2<br />
Change in accounting principle 149.8 544.6 694.4<br />
Adjusted carrying amount, January 1 1,786.6 1,552.8 1,409.0 1,545.9 3,195.6 3,098.7<br />
Investments 433.5 567.0 744.6 406.8 1,178.1 973.7<br />
Carrying amount, properties divested –733.8 –372.4 –606.0 –646.3 –1,339.8 –1,018.7<br />
Impairment losses/reversals <strong>of</strong> impairment losses 2.5 –9.0 –19.3 –5.2 –16.8 –14.2<br />
The year's provision for intra-Group pr<strong>of</strong>its in contracting work –10.3 –12.5 –10.3 –12.5<br />
Reclassifications –20.0 –36.8 3.1 28.5 –16.9 –8.4<br />
Exchange rate differences for the year 11.3 97.7 –1.8 79.4 9.6 177.0<br />
December 31 1,469.9 1,786.6 1,529.6 1,409.0 2,999.6 3,195.6<br />
The carrying amount <strong>of</strong> current-asset properties is allocated between properties carried<br />
at cost and properties carried at net realizable value, as shown in the following table:<br />
Dec 31,<br />
<strong>2010</strong><br />
Cost Net realizable value Total<br />
Dec 31,<br />
2009<br />
Commercial Property Development 1,452.4 1,653.0 1,472.5 17.5 133.6 80.3 1,469.9 1,786.6 1,552.8<br />
Residential Development 1,463.5 1,331.4 1,492.3 66.1 77.6 53.6 1,529.6 1,409.0 1,545.9<br />
Total 2,915.9 2,984.4 2,964.8 83.6 211.2 133.9 2,999.6 3,195.6 3,098.7<br />
Jan 1,<br />
2009<br />
Dec 31,<br />
<strong>2010</strong><br />
Dec 31,<br />
2009<br />
Jan 1,<br />
2009<br />
Dec 31,<br />
<strong>2010</strong><br />
Dec 31,<br />
2009<br />
Jan 1,<br />
2009<br />
<strong>Skanska</strong> <strong>Review</strong> <strong>of</strong> <strong>2010</strong> – <strong>USD</strong> <strong>version</strong> Notes, including accounting and valuation principles 129


