

Review of 2010 â USD version - Skanska
Review of 2010 â USD version - Skanska
Review of 2010 â USD version - Skanska

You also want an ePaper? Increase the reach of your titles
YUMPU automatically turns print PDFs into web optimized ePapers that Google loves.
Note<br />
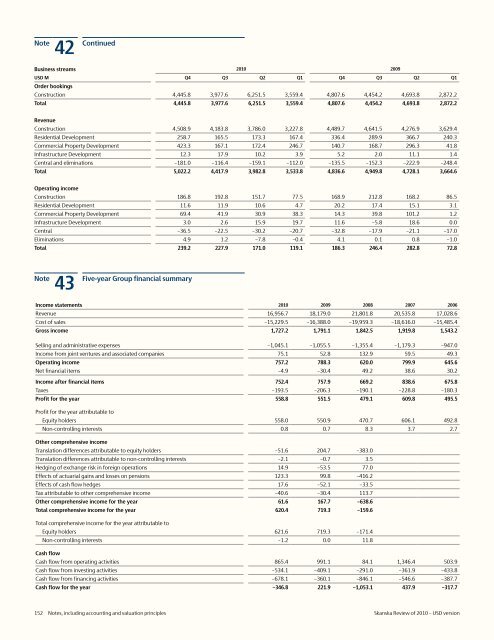
42 Continued<br />
Business streams <strong>2010</strong> 2009<br />
<strong>USD</strong> M Q4 Q3 Q2 Q1 Q4 Q3 Q2 Q1<br />
Order bookings<br />
Construction 4,445.8 3,977.6 6,251.5 3,559.4 4,807.6 4,454.2 4,693.8 2,872.2<br />
Total 4,445.8 3,977.6 6,251.5 3,559.4 4,807.6 4,454.2 4,693.8 2,872.2<br />
Revenue<br />
Construction 4,508.9 4,183.8 3,786.0 3,227.8 4,489.7 4,641.5 4,276.9 3,629.4<br />
Residential Development 258.7 165.5 173.3 167.4 336.4 289.9 366.7 240.3<br />
Commercial Property Development 423.3 167.1 172.4 246.7 140.7 168.7 296.3 41.8<br />
Infrastructure Development 12.3 17.9 10.2 3.9 5.2 2.0 11.1 1.4<br />
Central and eliminations –181.0 –116.4 –159.1 –112.0 –135.5 –152.3 –222.9 –248.4<br />
Total 5,022.2 4,417.9 3,982.8 3,533.8 4,836.6 4,949.8 4,728.1 3,664.6<br />
Operating income<br />
Construction 186.8 192.8 151.7 77.5 168.9 212.8 168.2 86.5<br />
Residential Development 11.6 11.9 10.6 4.7 20.2 17.4 15.1 3.1<br />
Commercial Property Development 69.4 41.9 30.9 38.3 14.3 39.8 101.2 1.2<br />
Infrastructure Development 3.0 2.6 15.9 19.7 11.6 –5.8 18.6 0.0<br />
Central –36.5 –22.5 –30.2 –20.7 –32.8 –17.9 –21.1 –17.0<br />
Eliminations 4.9 1.2 –7.8 –0.4 4.1 0.1 0.8 –1.0<br />
Total 239.2 227.9 171.0 119.1 186.3 246.4 282.8 72.8<br />
Note<br />
43<br />
Five-year Group financial summary<br />
Income statements <strong>2010</strong> 2009 2008 2007 2006<br />
Revenue 16,956.7 18,179.0 21,801.8 20,535.8 17,028.6<br />
Cost <strong>of</strong> sales –15,229.5 –16,388.0 –19,959.3 –18,616.0 –15,485.4<br />
Gross income 1,727.2 1,791.1 1,842.5 1,919.8 1,543.2<br />
Selling and administrative expenses –1,045.1 –1,055.5 –1,355.4 –1,179.3 –947.0<br />
Income from joint ventures and associated companies 75.1 52.8 132.9 59.5 49.3<br />
Operating income 757.2 788.3 620.0 799.9 645.6<br />
Net financial items –4.9 –30.4 49.2 38.6 30.2<br />
Income after financial items 752.4 757.9 669.2 838.6 675.8<br />
Taxes –193.5 –206.3 –190.1 –228.8 –180.3<br />
Pr<strong>of</strong>it for the year 558.8 551.5 479.1 609.8 495.5<br />
Pr<strong>of</strong>it for the year attributable to<br />
Equity holders 558.0 550.9 470.7 606.1 492.8<br />
Non-controlling interests 0.8 0.7 8.3 3.7 2.7<br />
Other comprehensive income<br />
Translation differences attributable to equity holders –51.6 204.7 –383.0<br />
Translation differences attributable to non-controlling interests –2.1 –0.7 3.5<br />
Hedging <strong>of</strong> exchange risk in foreign operations 14.9 –53.5 77.0<br />
Effects <strong>of</strong> actuarial gains and losses on pensions 123.3 99.8 –416.2<br />
Effects <strong>of</strong> cash flow hedges 17.6 –52.1 –33.5<br />
Tax attributable to other comprehensive income –40.6 –30.4 113.7<br />
Other comprehensive income for the year 61.6 167.7 –638.6<br />
Total comprehensive income for the year 620.4 719.3 –159.6<br />
Total comprehensive income for the year attributable to<br />
Equity holders 621.6 719.3 –171.4<br />
Non-controlling interests –1.2 0.0 11.8<br />
Cash flow<br />
Cash flow from operating activities 865.4 991.1 84.1 1,346.4 503.9<br />
Cash flow from investing activities –534.1 –409.1 –291.0 –361.9 –433.8<br />
Cash flow from financing activities –678.1 –360.1 –846.1 –546.6 –387.7<br />
Cash flow for the year –346.8 221.9 –1,053.1 437.9 –317.7<br />
152 Notes, including accounting and valuation principles <strong>Skanska</strong> <strong>Review</strong> <strong>of</strong> <strong>2010</strong> – <strong>USD</strong> <strong>version</strong>


