

Review of 2010 â USD version - Skanska
Review of 2010 â USD version - Skanska
Review of 2010 â USD version - Skanska

You also want an ePaper? Increase the reach of your titles
YUMPU automatically turns print PDFs into web optimized ePapers that Google loves.
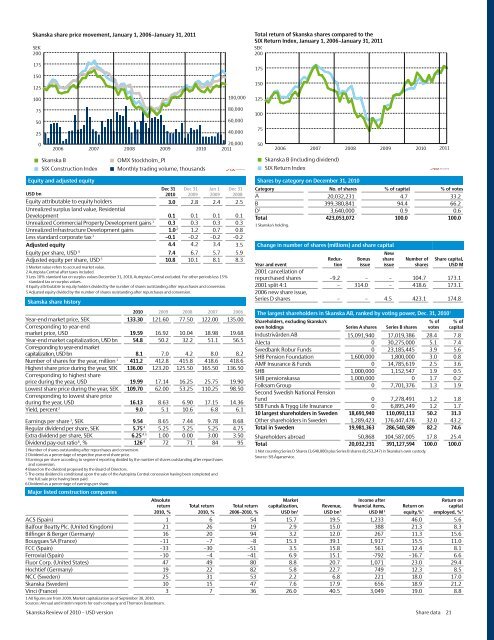
<strong>Skanska</strong> share price movement, January 1, 2006–January 31, 2011<br />
SEK<br />
200<br />
Total return <strong>of</strong> <strong>Skanska</strong> shares compared to the<br />
SIX Return Index, January 1, 2006–January 31, 2011<br />
SEK<br />
200<br />
175<br />
150<br />
125<br />
100<br />
75<br />
50<br />
25<br />
0<br />
Equity and adjusted equity<br />
<strong>USD</strong> bn<br />
2006<br />
• <strong>Skanska</strong> B<br />
SIX Construction Index<br />
Major listed construction companies<br />
The largest shareholders in <strong>Skanska</strong> AB, ranked by voting power, Dec. 31, <strong>2010</strong> 1<br />
Shareholders, excluding <strong>Skanska</strong>’s<br />
own holdings Series A shares Series B shares<br />
<strong>Skanska</strong> <strong>Review</strong> <strong>of</strong> <strong>2010</strong> – <strong>USD</strong> <strong>version</strong> Share data 21<br />
% <strong>of</strong><br />
votes<br />
% <strong>of</strong><br />
capital<br />
Industrivärden AB 15,091,940 17,019,386 28.4 7.8<br />
Alecta 0 30,275,000 5.1 7.4<br />
Swedbank Robur Funds 0 23,185,445 3.9 5.6<br />
SHB Pension Foundation 1,600,000 1,800,000 3.0 0.8<br />
AMF Insurance & Funds 0 14,785,619 2.5 3.6<br />
SHB 1,000,000 1,152,547 1.9 0.5<br />
SHB pensionskassa 1,000,000 0 1.7 0.2<br />
Folksam Group 0 7,701,376 1.3 1.9<br />
Second Swedish National Pension<br />
Fund 0 7,278,491 1.2 1.8<br />
SEB Funds & Trygg Life Insurance 0 6,895,249 1.2 1.7<br />
10 largest shareholders in Sweden 18,691,940 110,093,113 50.2 31.3<br />
Other shareholders in Sweden 1,289,423 176,447,476 32.0 43.2<br />
Total in Sweden 19,981,363 286,540,589 82.2 74.6<br />
Shareholders abroad 50,868 104,587,005 17.8 25.4<br />
Total 20,032,231 391,127,594 100.0 100.0<br />
1 Not counting Series D Shares (3,640,000) plus Series B shares (8,253,247) in <strong>Skanska</strong>’s own custody.<br />
Source: SIS Ägarservice.<br />
Absolute<br />
return Total return Total return<br />
Market<br />
capitalization, Revenue,<br />
Income after<br />
financial items, Return on<br />
Return on<br />
capital<br />
<strong>2010</strong>, % <strong>2010</strong>, % 2006–<strong>2010</strong>, % <strong>USD</strong> bn 1 <strong>USD</strong> bn 1 <strong>USD</strong> M 1 equity,% 1 employed, % 1<br />
ACS (Spain) 1 6 54 15.7 19.5 1,233 46.0 5.6<br />
Balfour Beatty Plc. (United Kingdom) 21 26 19 2.9 15.0 388 21.3 8.3<br />
Bilfinger & Berger (Germany) 16 20 94 3.2 12.0 267 11.3 15.6<br />
Bouygues SA (France) –11 –7 –8 15.3 39.1 1,917 15.5 11.0<br />
FCC (Spain) –33 –30 –51 3.5 15.8 561 12.4 8.1<br />
Ferrovial (Spain) –10 –4 –41 6.9 15.1 -792 –16.7 6.6<br />
Fluor Corp. (United States) 47 49 80 8.8 20.7 1,071 23.0 29.4<br />
Hochtief (Germany) 19 22 82 5.8 22.7 749 12.3 8.5<br />
NCC (Sweden) 25 31 53 2.2 6.8 221 18.0 17.0<br />
<strong>Skanska</strong> (Sweden) 10 15 47 7.6 17.9 656 18.9 21.2<br />
Vinci (France) 3 7 36 26.0 40.5 3,049 19.0 8.8<br />
1 All figures are from 2009, Market capitalization as <strong>of</strong> September 30, <strong>2010</strong>.<br />
Sources: Annual and interim reports for each company and Thomson Datastream.<br />
Dec 31<br />
<strong>2010</strong><br />
Dec 31<br />
2009<br />
Jan 1<br />
2009<br />
Dec 31<br />
2008<br />
Equity attributable to equity holders 3.0 2.8 2.4 2.5<br />
Unrealized surplus land value, Residential<br />
Development 0.1 0.1 0.1 0.1<br />
Unrealized Commercial Property Development gains 1 0.3 0.3 0.3 0.3<br />
Unrealized Infrastructure Development gains 1.0 2 1.2 0.7 0.8<br />
Less standard corporate tax 3 –0.1 –0.2 –0.2 –0.2<br />
Adjusted equity 4.4 4.2 3.4 3.5<br />
Equity per share, <strong>USD</strong> 4 7.4 6.7 5.7 5.9<br />
Adjusted equity per share, <strong>USD</strong> 5 10.8 10.1 8.1 8.3<br />
1 Market value refers to accrued market value.<br />
2 Autopista Central after taxes included.<br />
3 Less 10% standard tax on surplus values December 31, <strong>2010</strong>, Autopista Central excluded. For other periods less 15%<br />
standard tax on surplus values.<br />
4 Equity attributable to equity holders divided by the number <strong>of</strong> shares outstanding after repurchases and con<strong>version</strong>.<br />
5 Adjusted equity divided by the number <strong>of</strong> shares outstanding after repurchases and con<strong>version</strong>.<br />
<strong>Skanska</strong> share history<br />
2007<br />
20,000 50<br />
2008<br />
2009<br />
<strong>2010</strong> 2011<br />
OMX Stockholm_PI<br />
• Monthly trading volume, thousands<br />
<strong>2010</strong> 2009 2008 2007 2006<br />
Year-end market price, SEK 133.30 121.60 77.50 122.00 135.00<br />
Corresponding to year-end<br />
market price, <strong>USD</strong> 19.59 16.92 10.04 18.98 19.68<br />
Year-end market capitalization, <strong>USD</strong> bn 54.8 50.2 32.2 51.1 56.5<br />
Corresponding to year-end market<br />
capitalization, <strong>USD</strong> bn 8.1 7.0 4.2 8.0 8.2<br />
Number <strong>of</strong> shares for the year, million 1 411.2 412.8 415.8 418.6 418.6<br />
Highest share price during the year, SEK 136.00 123.20 125.50 165.50 136.50<br />
Corresponding to highest share<br />
price during the year, <strong>USD</strong> 19.99 17.14 16.25 25.75 19.90<br />
Lowest share price during the year, SEK 109.70 62.00 53.25 110.25 98.50<br />
Corresponding to lowest share price<br />
during the year, <strong>USD</strong> 16.13 8.63 6.90 17.15 14.36<br />
Yield, percent 2 9.0 5.1 10.6 6.8 6.1<br />
Earnings per share 3 , SEK 9.54 8.65 7.44 9.78 8.68<br />
Regular dividend per share, SEK 5.75 4 5.25 5.25 5.25 4.75<br />
Extra dividend per share, SEK 6.25 4.5 1.00 0.00 3.00 3.50<br />
Dividend pay-out ratio 6 , % 126 4 72 71 84 95<br />
1 Number <strong>of</strong> shares outstanding after repurchases and con<strong>version</strong>.<br />
2 Dividend as a percentage <strong>of</strong> respective year-end share price.<br />
3 Earnings per share according to segment reporting divided by the number <strong>of</strong> shares outstanding after repurchases<br />
and con<strong>version</strong>.<br />
4 Based on the dividend proposed by the Board <strong>of</strong> Directors.<br />
5 The extra dividend is conditional upon the sale <strong>of</strong> the Autopista Central concession having been completed and<br />
the full sale price having been paid.<br />
6 Dividend as a percentage <strong>of</strong> earnings per share.<br />
100,000<br />
80,000<br />
60,000<br />
40,000<br />
175<br />
150<br />
125<br />
100<br />
75<br />
<strong>Skanska</strong> B (including dividend)<br />
• SIX Return Index<br />
Shares by category on December 31, <strong>2010</strong><br />
Category No. <strong>of</strong> shares % <strong>of</strong> capital % <strong>of</strong> votes<br />
A 20,032,231 4.7 33.2<br />
B 399,380,841 94.4 66.2<br />
D 1 3,640,000 0.9 0.6<br />
Total 423,053,072 100.0 100.0<br />
1 <strong>Skanska</strong>’s holding.<br />
2006 2007<br />
2008<br />
2009<br />
<strong>2010</strong> 2011<br />
Change in number <strong>of</strong> shares (millions) and share capital<br />
Reduction<br />
Bonus<br />
issue<br />
New<br />
share<br />
issue<br />
Number <strong>of</strong><br />
shares<br />
Share capital,<br />
<strong>USD</strong> M<br />
Year and event<br />
2001 cancellation <strong>of</strong><br />
repurchased shares –9.2 – – 104.7 173.1<br />
2001 split 4:1 – 314.0 – 418.6 173.1<br />
2006 new share issue,<br />
Series D shares – – 4.5 423.1 174.8


