

Review of 2010 â USD version - Skanska
Review of 2010 â USD version - Skanska
Review of 2010 â USD version - Skanska

You also want an ePaper? Increase the reach of your titles
YUMPU automatically turns print PDFs into web optimized ePapers that Google loves.
37 Continued Business unit Measure <strong>of</strong> earnings<br />
Note<br />
Other members <strong>of</strong> the Senior Executive Team<br />
During <strong>2010</strong>, one new person joined the Senior Executive Team. The other members <strong>of</strong><br />
the Senior Executive Team thus totaled nine persons during the financial year.<br />
Members <strong>of</strong> the Senior Executive Team received a fixed salary and variable remuneration<br />
mainly based on the Group’s earnings and/or the earnings <strong>of</strong> the business units they<br />
are directly responsible for. In addition, senior executives were covered by the Group’s<br />
Employee Ownership Program, with an allocation <strong>of</strong> matching shares and performance<br />
shares, defined in the section entitled “Long-term share programs” in this note. A total<br />
<strong>of</strong> 24,773 shares were purchased by the other members <strong>of</strong> the Senior Executive Team<br />
during <strong>2010</strong>, which resulted in 6,193 matching shares, equivalent to <strong>USD</strong> 121,400. An<br />
estimated 92 898 performance shares will be allocated, at a value <strong>of</strong> <strong>USD</strong> 1,820,200,<br />
since the “Outperform” targets were 100 percent fulfilled. The stated value refers to the<br />
share price on December 30, <strong>2010</strong> (SEK 133.30, corresponding to <strong>USD</strong> 19.59). Variable<br />
remuneration as well as the outcome <strong>of</strong> performance shares are preliminary and the<br />
final outcome will be established by the Board after a follow-up <strong>of</strong> operations during<br />
the first quarter <strong>of</strong> 2011. Disbursement normally occurs during May <strong>of</strong> the year after the<br />
performance year.<br />
During <strong>2010</strong> the other members <strong>of</strong> the Senior Executive Team also received 26,360<br />
shares, equivalent to <strong>USD</strong> 433,000, attributable to the earlier share incentive program,<br />
the <strong>Skanska</strong> Share Award Plan, which is related to remuneration for the performance<br />
year 2006. See the section entitled “Long-term share programs.”<br />
All above-mentioned remuneration and benefits were charged to <strong>Skanska</strong> AB, except<br />
<strong>USD</strong> 3,482,200 to other members <strong>of</strong> the Senior Executive Team which was charged to<br />
other Group companies.<br />
Pension obligations to current and previous senior executives<br />
In <strong>2010</strong>, outstanding pension obligations to Presidents and CEOs including former Presidents<br />
and CEOs amounted to <strong>USD</strong> 16,992,500. Outstanding obligations to other current<br />
and former members <strong>of</strong> the Senior Executive Team amounted to <strong>USD</strong> 14,918,000.<br />
Long-term share programs<br />
Share Incentive Program – <strong>Skanska</strong> Employee Ownership Program, SEOP1 and SEOP2<br />
Share Incentive Program – <strong>Skanska</strong> Employee Ownership Program, SEOP1 (2008–<strong>2010</strong>)<br />
In 2007, an Extraordinary Shareholders’ Meeting <strong>of</strong> <strong>Skanska</strong> approved the introduction<br />
<strong>of</strong> a long-term share ownership program for employees <strong>of</strong> the <strong>Skanska</strong> Group, which<br />
replaced the earlier three-year share incentive program that expired during 2007. The<br />
program is aimed at about 40,000 permanent employees <strong>of</strong> the <strong>Skanska</strong> Group, <strong>of</strong><br />
whom some 2,000 key employees and about 300 executives, including the President<br />
and CEO and the rest <strong>of</strong> the Senior Executive Team.<br />
The program <strong>of</strong>fers employees, key employees and executives the opportunity − provided<br />
they have made their own investment in Series B <strong>Skanska</strong> shares during a given<br />
financial year − to receive Series B <strong>Skanska</strong> shares from <strong>Skanska</strong> free <strong>of</strong> charge. For each<br />
four Series B “investment” shares purchased, the employee will be entitled, after a<br />
three-year vesting period, to receive 1 Series B <strong>Skanska</strong> share free <strong>of</strong> charge. In addition,<br />
depending on the fulfillment <strong>of</strong> certain earnings-based performance conditions during<br />
the purchase period, after the vesting period the employee will be able to receive additional<br />
Series B <strong>Skanska</strong> shares free <strong>of</strong> charge.<br />
The purchase period covered the years 2008–<strong>2010</strong> and the vesting period runs for<br />
three years from the date the employee invests in shares. For each 4 investment shares<br />
purchased, employees may − in addition to 1 matching share − receive a maximum <strong>of</strong><br />
3 performance shares. For each 4 investment shares, key employees may − in addition<br />
to 1 matching share − receive a maximum <strong>of</strong> 7 performance shares. For each 4 investment<br />
shares, executives may − in addition to 1 matching share − receive a maximum <strong>of</strong><br />
15 performance shares.<br />
The maximum number <strong>of</strong> investment shares that each employee participating in the<br />
program may acquire, through monthly savings, depends on the employee’s salary and<br />
whether an employee is participating in the program as an employee, a key employee<br />
or an executive. To be able to receive matching and performance shares, a person must<br />
be employed in the <strong>Skanska</strong> Group throughout the vesting period and must, during this<br />
period, have kept his or her investment shares.<br />
The program has two cost ceilings. The first one depends on the extent to which financial<br />
“SEOP-specific Outperform targets” are met, which limits <strong>Skanska</strong>’s total cost per year<br />
to <strong>USD</strong> 29–92 M, related to fulfillment <strong>of</strong> the financial “SEOP-specific Outperform targets”<br />
at the Group level. The other cost ceiling is that <strong>Skanska</strong>’s total cost per year may not<br />
exceed 15 percent <strong>of</strong> earnings before interest and taxes (EBIT). The actual cost ceiling is the<br />
lower <strong>of</strong> these two cost ceilings. In addition to the cost ceilings, the number <strong>of</strong> shares that<br />
may be repurchased as part <strong>of</strong> the program is also limited to 13,500,000 shares.<br />
In the <strong>Skanska</strong> Group, a total <strong>of</strong> 19 percent <strong>of</strong> permanent employees participated.<br />
The total cost <strong>of</strong> SEOP1 excluding social insurance contributions is estimated at<br />
<strong>USD</strong> 94.7 M, <strong>of</strong> which 19.7 M was recognized as an expense in 2008 and 2009, while the<br />
cost in <strong>2010</strong> totaled about <strong>USD</strong> 26.5 M. The remaining cost <strong>of</strong> SEOP1 through 2013 is<br />
estimated at about <strong>USD</strong> 48.5 M.<br />
The dilution effect through <strong>2010</strong> is estimated at 3,524,779 shares or 0.85 percent <strong>of</strong><br />
the number <strong>of</strong> shares outstanding. Maximum dilution for the program at the end <strong>of</strong> the<br />
vesting period in 2013 is projected at 6,818,633 shares or 1.59 percent.<br />
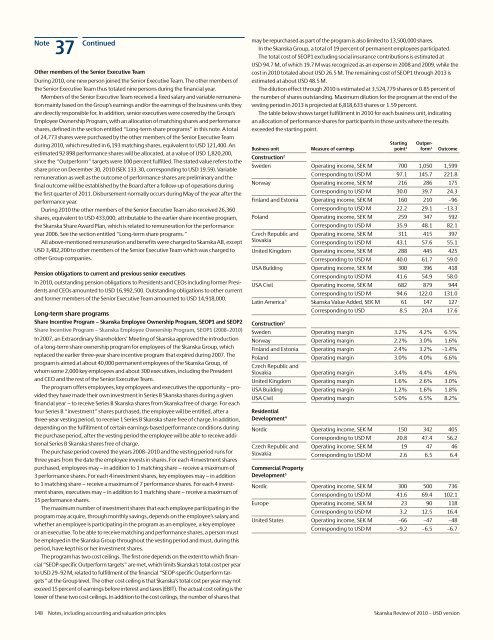
The table below shows target fulfillment in <strong>2010</strong> for each business unit, indicating<br />
an allocation <strong>of</strong> performance shares for participants in those units where the results<br />
exceeded the starting point.<br />
Construction 2<br />
Starting<br />
point 1<br />
Outperform<br />
1<br />
Outcome<br />
Sweden Operating income, SEK M 700 1,050 1,599<br />
Corresponding to <strong>USD</strong> M 97.1 145.7 221.8<br />
Norway Operating income, SEK M 216 286 175<br />
Corresponding to <strong>USD</strong> M 30.0 39.7 24.3<br />
Finland and Estonia Operating income, SEK M 160 210 –96<br />
Corresponding to <strong>USD</strong> M 22.2 29.1 –13.3<br />
Poland Operating income, SEK M 259 347 592<br />
Corresponding to <strong>USD</strong> M 35.9 48.1 82.1<br />
Czech Republic and Operating income, SEK M 311 415 397<br />
Slovakia<br />
Corresponding to <strong>USD</strong> M 43.1 57.6 55.1<br />
United Kingdom Operating income, SEK M 288 445 425<br />
Corresponding to <strong>USD</strong> M 40.0 61.7 59.0<br />
USA Building Operating income, SEK M 300 396 418<br />
Corresponding to <strong>USD</strong> M 41.6 54.9 58.0<br />
USA Civil Operating income, SEK M 682 879 944<br />
Corresponding to <strong>USD</strong> M 94.6 122.0 131.0<br />
Latin America 3 <strong>Skanska</strong> Value Added, SEK M 61 147 127<br />
Construction 2<br />
Corresponding to <strong>USD</strong> 8.5 20.4 17.6<br />
Sweden Operating margin 3.2% 4.2% 6.5%<br />
Norway Operating margin 2.2% 3.0% 1.6%<br />
Finland and Estonia Operating margin 2.4% 3.2% –1.4%<br />
Poland Operating margin 3.0% 4.0% 6.6%<br />
Czech Republic and<br />
Slovakia Operating margin 3.4% 4.4% 4.6%<br />
United Kingdom Operating margin 1.6% 2.6% 3.0%<br />
USA Building Operating margin 1.2% 1.6% 1.8%<br />
USA Civil Operating margin 5.0% 6.5% 8.2%<br />
Residential<br />
Development 4<br />
Nordic Operating income, SEK M 150 342 405<br />
Corresponding to <strong>USD</strong> M 20.8 47.4 56.2<br />
Czech Republic and Operating income, SEK M 19 47 46<br />
Slovakia Corresponding to <strong>USD</strong> M 2.6 6.5 6.4<br />
Commercial Property<br />
Development 5<br />
Nordic Operating income, SEK M 300 500 736<br />
Corresponding to <strong>USD</strong> M 41.6 69.4 102.1<br />
Europe Operating income, SEK M 23 90 118<br />
Corresponding to <strong>USD</strong> M 3.2 12.5 16.4<br />
United States Operating income, SEK M –66 –47 –48<br />
Corresponding to <strong>USD</strong> M –9.2 –6.5 –6.7<br />
148 Notes, including accounting and valuation principles <strong>Skanska</strong> <strong>Review</strong> <strong>of</strong> <strong>2010</strong> – <strong>USD</strong> <strong>version</strong>


