

Review of 2010 â USD version - Skanska
Review of 2010 â USD version - Skanska
Review of 2010 â USD version - Skanska

Create successful ePaper yourself
Turn your PDF publications into a flip-book with our unique Google optimized e-Paper software.
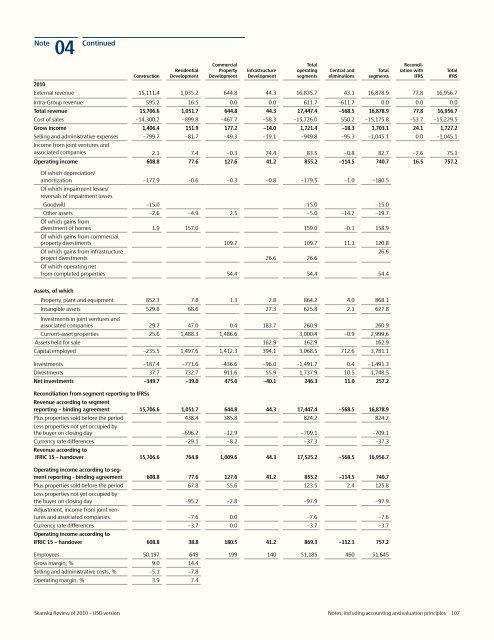
Note<br />
04 Continued<br />
Construction<br />
Residential<br />
Development<br />
Commercial<br />
Property<br />
Development<br />
Infrastructure<br />
Development<br />
Total<br />
operating<br />
segments<br />
Central and<br />
eliminations<br />
Total<br />
segments<br />
Reconciliation<br />
with<br />
IFRS<br />
<strong>2010</strong><br />
External revenue 15,111.4 1,035.2 644.8 44.3 16,835.7 43.1 16,878.9 77.8 16,956.7<br />
Intra-Group revenue 595.2 16.5 0.0 0.0 611.7 –611.7 0.0 0.0 0.0<br />
Total revenue 15,706.6 1,051.7 644.8 44.3 17,447.4 –568.5 16,878.9 77.8 16,956.7<br />
Cost <strong>of</strong> sales –14,300.2 –899.8 –467.7 –58.3 –15,726.0 550.2 –15,175.8 –53.7 –15,229.5<br />
Gross income 1,406.4 151.9 177.2 –14.0 1,721.4 –18.3 1,703.1 24.1 1,727.2<br />
Selling and administrative expenses –799.7 –81.7 –49.3 –19.1 –949.8 –95.3 –1,045.1 0.0 –1,045.1<br />
Income from joint ventures and<br />
associated companies 2.1 7.4 –0.3 74.4 83.5 –0.8 82.7 –7.6 75.1<br />
Operating income 608.8 77.6 127.6 41.2 855.2 –114.5 740.7 16.5 757.2<br />
Of which depreciation/<br />
amortization –177.9 –0.6 –0.3 –0.8 –179.5 –1.0 –180.5<br />
Of which impairment losses/<br />
reversals <strong>of</strong> impairment losses<br />
Goodwill –15.0 –15.0 –15.0<br />
Other assets –2.6 –4.9 2.5 –5.0 –14.7 –19.7<br />
Of which gains from<br />
divestment <strong>of</strong> homes 1.9 157.0 159.0 –0.1 158.9<br />
Of which gains from commercial<br />
property divestments 109.7 109.7 11.1 120.8<br />
Of which gains from infrastructure<br />
project divestments 26.6 26.6<br />
Of which operating net<br />
from completed properties 54.4 54.4 54.4<br />
26.6<br />
Total<br />
IFRS<br />
Assets, <strong>of</strong> which<br />
Property, plant and equipment 852.3 7.8 1.3 2.8 864.2 4.0 868.1<br />
Intangible assets 529.8 68.6 27.3 625.8 2.1 627.8<br />
Investments in joint ventures and<br />
associated companies 29.7 47.0 0.4 183.7 260.9 260.9<br />
Current-asset properties 25.6 1,488.3 1,486.6 3,000.4 –0.9 2,999.6<br />
Assets held for sale 162.9 162.9 162.9<br />
Capital employed –235.5 1,497.6 1,412.3 394.1 3,068.5 712.6 3,781.1<br />
Investments –187.4 –771.6 –436.6 –96.0 –1,491.7 0.4 –1,491.3<br />
Divestments 37.7 732.7 911.6 55.9 1,737.9 10.5 1,748.5<br />
Net investments –149.7 –39.0 475.0 –40.1 246.3 11.0 257.2<br />
Reconciliation from segment reporting to IFRSs<br />
Revenue according to segment<br />
reporting – binding agreement 15,706.6 1,051.7 644.8 44.3 17,447.4 –568.5 16,878.9<br />
Plus properties sold before the period 438.4 385.8 824.2 824.2<br />
Less properties not yet occupied by<br />
the buyer on closing day –696.2 –12.9 –709.1 –709.1<br />
Currency rate differences –29.1 –8.2 –37.3 –37.3<br />
Revenue according to<br />
IFRIC 15 – handover 15,706.6 764.8 1,009.6 44.3 17,525.2 –568.5 16,956.7<br />
Operating income according to segment<br />
reporting - binding agreement 608.8 77.6 127.6 41.2 855.2 –114.5 740.7<br />
Plus properties sold before the period 67.8 55.6 123.5 2.4 125.8<br />
Less properties not yet occupied by<br />
the buyer on closing day –95.2 –2.8 –97.9 –97.9<br />
Adjustment, income from joint ventures<br />
and associated companies –7.6 0.0 –7.6 –7.6<br />
Currency rate differences –3.7 0.0 –3.7 –3.7<br />
Operating income according to<br />
IFRIC 15 – handover 608.8 38.8 180.5 41.2 869.3 –112.1 757.2<br />
Employees 50,197 649 199 140 51,185 460 51,645<br />
Gross margin, % 9.0 14.4<br />
Selling and administrative costs, % –5.1 –7.8<br />
Operating margin, % 3.9 7.4<br />
<strong>Skanska</strong> <strong>Review</strong> <strong>of</strong> <strong>2010</strong> – <strong>USD</strong> <strong>version</strong> Notes, including accounting and valuation principles 107


