

Review of 2010 â USD version - Skanska
Review of 2010 â USD version - Skanska
Review of 2010 â USD version - Skanska

You also want an ePaper? Increase the reach of your titles
YUMPU automatically turns print PDFs into web optimized ePapers that Google loves.
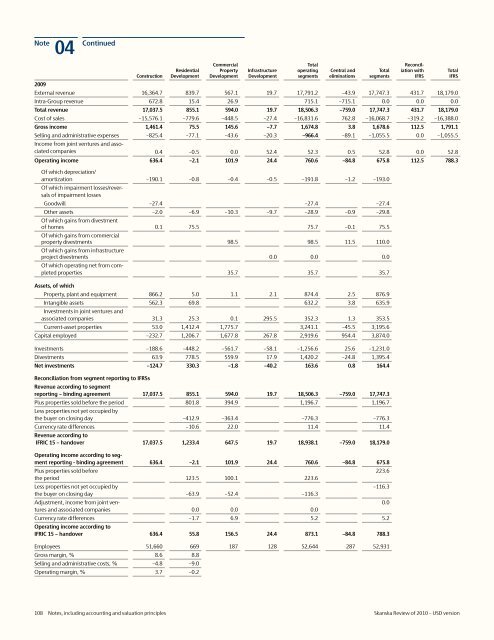
Note<br />
04 Continued Construction<br />
Residential<br />
Development<br />
Commercial<br />
Property<br />
Development<br />
Infrastructure<br />
Development<br />
Total<br />
operating<br />
segments<br />
Central and<br />
eliminations<br />
Total<br />
segments<br />
Reconciliation<br />
with<br />
IFRS<br />
2009<br />
External revenue 16,364.7 839.7 567.1 19.7 17,791.2 –43.9 17,747.3 431.7 18,179.0<br />
Intra-Group revenue 672.8 15.4 26.9 715.1 –715.1 0.0 0.0 0.0<br />
Total revenue 17,037.5 855.1 594.0 19.7 18,506.3 –759.0 17,747.3 431.7 18,179.0<br />
Cost <strong>of</strong> sales –15,576.1 –779.6 –448.5 –27.4 –16,831.6 762.8 –16,068.7 –319.2 –16,388.0<br />
Gross income 1,461.4 75.5 145.6 –7.7 1,674.8 3.8 1,678.6 112.5 1,791.1<br />
Selling and administrative expenses –825.4 –77.1 –43.6 –20.3 –966.4 –89.1 –1,055.5 0.0 –1,055.5<br />
Income from joint ventures and associated<br />
companies 0.4 –0.5 0.0 52.4 52.3 0.5 52.8 0.0 52.8<br />
Operating income 636.4 –2.1 101.9 24.4 760.6 –84.8 675.8 112.5 788.3<br />
Of which depreciation/<br />
amortization –190.1 –0.8 –0.4 –0.5 –191.8 –1.2 –193.0<br />
Of which impairment losses/reversals<br />
<strong>of</strong> impairment losses<br />
Goodwill –27.4 –27.4 –27.4<br />
Other assets –2.0 –6.9 –10.3 –9.7 –28.9 –0.9 –29.8<br />
Of which gains from divestment<br />
<strong>of</strong> homes 0.1 75.5 75.7 –0.1 75.5<br />
Of which gains from commercial<br />
property divestments 98.5 98.5 11.5 110.0<br />
Of which gains from infrastructure<br />
project divestments 0.0 0.0 0.0<br />
Of which operating net from completed<br />
properties 35.7 35.7 35.7<br />
Assets, <strong>of</strong> which<br />
Property, plant and equipment 866.2 5.0 1.1 2.1 874.4 2.5 876.9<br />
Intangible assets 562.3 69.8 632.2 3.8 635.9<br />
Investments in joint ventures and<br />
associated companies 31.3 25.3 0.1 295.5 352.3 1.3 353.5<br />
Current-asset properties 53.0 1,412.4 1,775.7 3,241.1 –45.5 3,195.6<br />
Capital employed –232.7 1,206.7 1,677.8 267.8 2,919.6 954.4 3,874.0<br />
Investments –188.6 –448.2 –561.7 –58.1 –1,256.6 25.6 –1,231.0<br />
Divestments 63.9 778.5 559.9 17.9 1,420.2 –24.8 1,395.4<br />
Net investments –124.7 330.3 –1.8 –40.2 163.6 0.8 164.4<br />
Reconciliation from segment reporting to IFRSs<br />
Revenue according to segment<br />
reporting – binding agreement 17,037.5 855.1 594.0 19.7 18,506.3 –759.0 17,747.3<br />
Plus properties sold before the period 801.8 394.9 1,196.7 1,196.7<br />
Less properties not yet occupied by<br />
the buyer on closing day –412.9 –363.4 –776.3 –776.3<br />
Currency rate differences –10.6 22.0 11.4 11.4<br />
Revenue according to<br />
IFRIC 15 – handover 17,037.5 1,233.4 647.5 19.7 18,938.1 –759.0 18,179.0<br />
Operating income according to segment<br />
reporting - binding agreement 636.4 –2.1 101.9 24.4 760.6 –84.8 675.8<br />
Plus properties sold before<br />
the period 123.5 100.1 223.6<br />
Less properties not yet occupied by<br />
the buyer on closing day –63.9 –52.4 –116.3<br />
Adjustment, income from joint ventures<br />
and associated companies 0.0 0.0 0.0<br />
Currency rate differences –1.7 6.9 5.2 5.2<br />
Operating income according to<br />
IFRIC 15 – handover 636.4 55.8 156.5 24.4 873.1 –84.8 788.3<br />
Employees 51,660 669 187 128 52,644 287 52,931<br />
Gross margin, % 8.6 8.8<br />
Selling and administrative costs, % –4.8 –9.0<br />
Operating margin, % 3.7 –0.2<br />
223.6<br />
–116.3<br />
0.0<br />
Total<br />
IFRS<br />
108 Notes, including accounting and valuation principles <strong>Skanska</strong> <strong>Review</strong> <strong>of</strong> <strong>2010</strong> – <strong>USD</strong> <strong>version</strong>


