

Review of 2010 â USD version - Skanska
Review of 2010 â USD version - Skanska
Review of 2010 â USD version - Skanska

Create successful ePaper yourself
Turn your PDF publications into a flip-book with our unique Google optimized e-Paper software.
To win<br />
the New<br />
Karolinska Solna<br />
project, <strong>Skanska</strong><br />
brought together its<br />
hospital construction<br />
and PPP expertise<br />
from Sweden, the<br />
U.K. and the U.S.<br />
and payment risks are higher, while it also has major<br />
potential for increasing the return on its investment by<br />
means <strong>of</strong> more efficient operation and higher utilization.<br />
In the market risk model, <strong>Skanska</strong>’s investment consists<br />
largely <strong>of</strong> share capital. Payment streams thus consist<br />
mainly <strong>of</strong> dividends, which are determined by the pr<strong>of</strong>itability<br />
<strong>of</strong> the facility. The market risk model is more<br />
common in the U.S. and Latin America.<br />
Financing <strong>of</strong> projects<br />
The financing <strong>of</strong> a project or project company is allocated<br />
between <strong>Skanska</strong> and its partner(s), which invest<br />
in the project company in the form <strong>of</strong> equity and subordinated<br />
shareholder loans. The rest <strong>of</strong> the financing −<br />
which in availability model projects may total more than<br />
90 percent and in market risk model projects 60–80 percent<br />
<strong>of</strong> project cost − consists <strong>of</strong> bank or bond loans.<br />
Cash flows from the project company to <strong>Skanska</strong><br />
consist <strong>of</strong> interest and principal repayments on subordinated<br />
loans issued by <strong>Skanska</strong>, dividends from<br />
project company pr<strong>of</strong>its and, finally, repayment <strong>of</strong> share<br />
capital. In the current project portfolio, <strong>Skanska</strong>’s ownership<br />
stake in project companies normally does not<br />
exceed 50 percent, and <strong>Skanska</strong> thus does not exercise<br />
any controlling ownership role.<br />
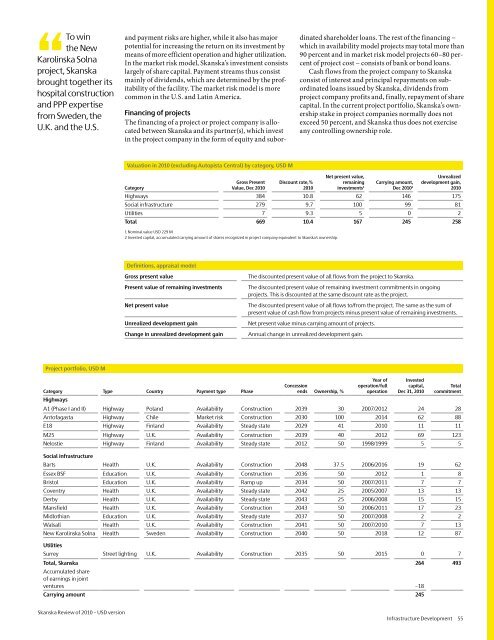
Valuation in <strong>2010</strong> (excluding Autopista Central) by category, <strong>USD</strong> M<br />
Category<br />
Gross Present<br />
Value, Dec <strong>2010</strong><br />
Discount rate,%<br />
<strong>2010</strong><br />
Net present value,<br />
remaining<br />
investments 1<br />
Carrying amount,<br />
Dec <strong>2010</strong> 2<br />
Unrealized<br />
development gain,<br />
<strong>2010</strong><br />
Highways 384 10.8 62 146 175<br />
Social infrastructure 279 9.7 100 99 81<br />
Utilities 7 9.3 5 0 2<br />
Total 669 10.4 167 245 258<br />
1 Nominal value <strong>USD</strong> 229 M<br />
2 Invested capital, accumulated carrying amount <strong>of</strong> shares recognized in project company equivalent to <strong>Skanska</strong>’s ownership.<br />
Definitions, appraisal model<br />
Gross present value<br />
Present value <strong>of</strong> remaining investments<br />
Net present value<br />
Unrealized development gain<br />
Change in unrealized development gain<br />
The discounted present value <strong>of</strong> all flows from the project to <strong>Skanska</strong>.<br />
The discounted present value <strong>of</strong> remaining investment commitments in ongoing<br />
projects. This is discounted at the same discount rate as the project.<br />
The discounted present value <strong>of</strong> all flows to/from the project. The same as the sum <strong>of</strong><br />
present value <strong>of</strong> cash flow from projects minus present value <strong>of</strong> remaining investments.<br />
Net present value minus carrying amount <strong>of</strong> projects.<br />
Annual change in unrealized development gain.<br />
Project portfolio, <strong>USD</strong> M<br />
Category Type Country Payment type Phase<br />
Highways<br />
Concession<br />
ends Ownership, %<br />
Year <strong>of</strong><br />
operation/full<br />
operation<br />
Invested<br />
capital,<br />
Dec 31, <strong>2010</strong><br />
Total<br />
commitment<br />
A1 (Phase I and II) Highway Poland Availability Construction 2039 30 2007/2012 24 28<br />
Ant<strong>of</strong>agasta Highway Chile Market risk Construction 2030 100 2014 62 88<br />
E18 Highway Finland Availability Steady state 2029 41 <strong>2010</strong> 11 11<br />
M25 Highway U.K. Availability Construction 2039 40 2012 69 123<br />
Nelostie Highway Finland Availability Steady state 2012 50 1998/1999 5 5<br />
Social infrastructure<br />
Barts Health U.K. Availability Construction 2048 37.5 2006/2016 19 62<br />
Essex BSF Education U.K. Availability Construction 2036 50 2012 1 8<br />
Bristol Education U.K. Availability Ramp up 2034 50 2007/2011 7 7<br />
Coventry Health U.K. Availability Steady state 2042 25 2005/2007 13 13<br />
Derby Health U.K. Availability Steady state 2043 25 2006/2008 15 15<br />
Mansfield Health U.K. Availability Construction 2043 50 2006/2011 17 23<br />
Midlothian Education U.K. Availability Steady state 2037 50 2007/2008 2 2<br />
Walsall Health U.K. Availability Construction 2041 50 2007/<strong>2010</strong> 7 13<br />
New Karolinska Solna Health Sweden Availability Construction 2040 50 2018 12 87<br />
Utilities<br />
Surrey Street lighting U.K. Availability Construction 2035 50 2015 0 7<br />
Total, <strong>Skanska</strong> 264 493<br />
Accumulated share<br />
<strong>of</strong> earnings in joint<br />
ventures –18<br />
Carrying amount 245<br />
<strong>Skanska</strong> <strong>Review</strong> <strong>of</strong> <strong>2010</strong> – <strong>USD</strong> <strong>version</strong><br />
Infrastructure Development 55


