

Review of 2010 â USD version - Skanska
Review of 2010 â USD version - Skanska
Review of 2010 â USD version - Skanska

You also want an ePaper? Increase the reach of your titles
YUMPU automatically turns print PDFs into web optimized ePapers that Google loves.
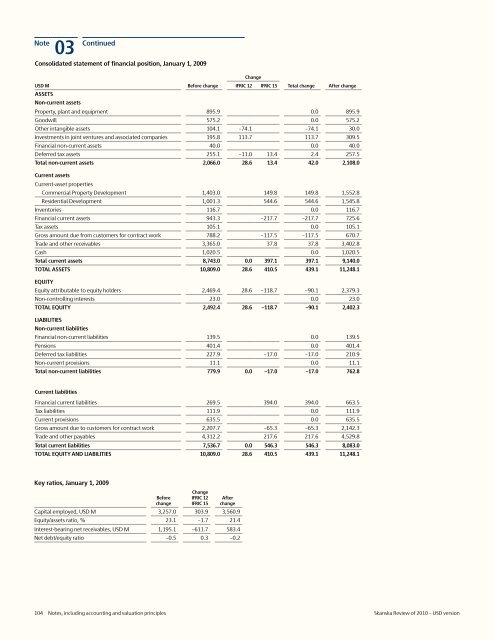
Note<br />
03 Continued<br />
Consolidated statement <strong>of</strong> financial position, January 1, 2009<br />
Change<br />
<strong>USD</strong> M Before change IFRIC 12 IFRIC 15 Total change After change<br />
ASSETS<br />
Non-current assets<br />
Property, plant and equipment 895.9 0.0 895.9<br />
Goodwill 575.2 0.0 575.2<br />
Other intangible assets 104.1 –74.1 –74.1 30.0<br />
Investments in joint ventures and associated companies 195.8 113.7 113.7 309.5<br />
Financial non-current assets 40.0 0.0 40.0<br />
Deferred tax assets 255.1 –11.0 13.4 2.4 257.5<br />
Total non-current assets 2,066.0 28.6 13.4 42.0 2,108.0<br />
Current assets<br />
Current-asset properties<br />
Commercial Property Development 1,403.0 149.8 149.8 1,552.8<br />
Residential Development 1,001.3 544.6 544.6 1,545.8<br />
Inventories 116.7 0.0 116.7<br />
Financial current assets 943.3 –217.7 –217.7 725.6<br />
Tax assets 105.1 0.0 105.1<br />
Gross amount due from customers for contract work 788.2 –117.5 –117.5 670.7<br />
Trade and other receivables 3,365.0 37.8 37.8 3,402.8<br />
Cash 1,020.5 0.0 1,020.5<br />
Total current assets 8,743.0 0.0 397.1 397.1 9,140.0<br />
TOTAL ASSETS 10,809.0 28.6 410.5 439.1 11,248.1<br />
EQUITY<br />
Equity attributable to equity holders 2,469.4 28.6 –118.7 –90.1 2,379.3<br />
Non-controlling interests 23.0 0.0 23.0<br />
TOTAL EQUITY 2,492.4 28.6 –118.7 –90.1 2,402.3<br />
LIABILITIES<br />
Non-current liabilities<br />
Financial non-current liabilities 139.5 0.0 139.5<br />
Pensions 401.4 0.0 401.4<br />
Deferred tax liabilities 227.9 –17.0 –17.0 210.9<br />
Non-current provisions 11.1 0.0 11.1<br />
Total non-current liabilities 779.9 0.0 –17.0 –17.0 762.8<br />
Current liabilities<br />
Financial current liabilities 269.5 394.0 394.0 663.5<br />
Tax liabilities 111.9 0.0 111.9<br />
Current provisions 635.5 0.0 635.5<br />
Gross amount due to customers for contract work 2,207.7 –65.3 –65.3 2,142.3<br />
Trade and other payables 4,312.2 217.6 217.6 4,529.8<br />
Total current liabilities 7,536.7 0.0 546.3 546.3 8,083.0<br />
TOTAL EQUITY AND LIABILITIES 10,809.0 28.6 410.5 439.1 11,248.1<br />
Key ratios, January 1, 2009<br />
Before<br />
change<br />
Change<br />
IFRIC 12<br />
IFRIC 15<br />
After<br />
change<br />
Capital employed, <strong>USD</strong> M 3,257.0 303.9 3,560.9<br />
Equity/assets ratio, % 23.1 –1.7 21.4<br />
Interest-bearing net receivables, <strong>USD</strong> M 1,195.1 –611.7 583.4<br />
Net debt/equity ratio –0.5 0.3 –0.2<br />
104 Notes, including accounting and valuation principles <strong>Skanska</strong> <strong>Review</strong> <strong>of</strong> <strong>2010</strong> – <strong>USD</strong> <strong>version</strong>


