

Review of 2010 â USD version - Skanska
Review of 2010 â USD version - Skanska
Review of 2010 â USD version - Skanska

You also want an ePaper? Increase the reach of your titles
YUMPU automatically turns print PDFs into web optimized ePapers that Google loves.
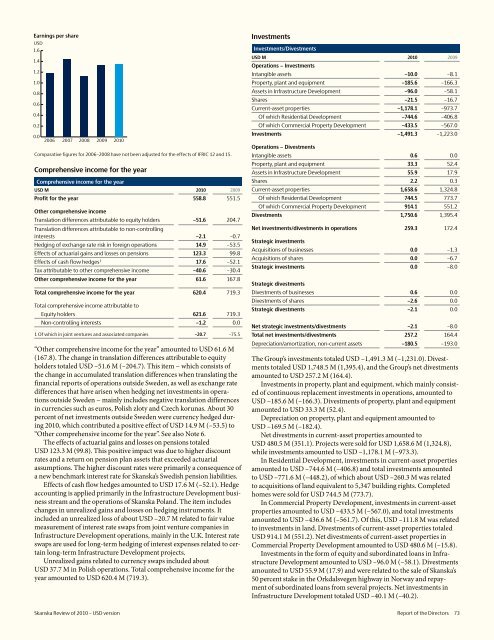
Earnings per share<br />
<strong>USD</strong><br />
1.6<br />
Investments<br />
Investments/Divestments<br />
1.4<br />
1.2<br />
<strong>USD</strong> M <strong>2010</strong> 2009<br />
Operations − Investments<br />
Intangible assets –10.0 –8.1<br />
1.0<br />
Property, plant and equipment –185.6 –166.3<br />
0.8<br />
0.6<br />
0.4<br />
Assets in Infrastructure Development –96.0 –58.1<br />
Shares –21.5 –16.7<br />
Current-asset properties –1,178.1 –973.7<br />
Of which Residential Development –744.6 –406.8<br />
0.2<br />
Of which Commercial Property Development –433.5 –567.0<br />
09<br />
<strong>2010</strong><br />
0.0<br />
2006 2007 2008 2009 <strong>2010</strong><br />
Comparative figures for 2006–2008 have not been adjusted for the effects <strong>of</strong> IFRIC 12 and 15.<br />
Investments –1,491.3 –1,223.0<br />
Operations − Divestments<br />
Intangible assets 0.6 0.0<br />
Comprehensive income for the year<br />
Property, plant and equipment 33.3 52.4<br />
Assets in Infrastructure Development 55.9 17.9<br />
Comprehensive income for the year<br />
Shares 2.2 0.3<br />
<strong>USD</strong> M <strong>2010</strong> 2009<br />
Current-asset properties 1,658.6 1,324.8<br />
Pr<strong>of</strong>it for the year 558.8 551.5<br />
Of which Residential Development 744.5 773.7<br />
Other comprehensive income<br />
Translation differences attributable to equity holders –51.6 204.7<br />
Of which Commercial Property Development 914.1 551.2<br />
Divestments 1,750.6 1,395.4<br />
Translation differences attributable to non-controlling<br />
interests –2.1 –0.7<br />
Hedging <strong>of</strong> exchange rate risk in foreign operations 14.9 –53.5<br />
Effects <strong>of</strong> actuarial gains and losses on pensions 123.3 99.8<br />
Effects <strong>of</strong> cash flow hedges 1 17.6 –52.1<br />
Tax attributable to other comprehensive income –40.6 –30.4<br />
Net investments/divestments in operations 259.3 172.4<br />
Strategic investments<br />
Acquisitions <strong>of</strong> businesses 0.0 –1.3<br />
Acquisitions <strong>of</strong> shares 0.0 –6.7<br />
Strategic investments 0.0 –8.0<br />
Other comprehensive income for the year 61.6 167.8<br />
Strategic divestments<br />
Divestments <strong>of</strong> businesses 0.6 0.0<br />
Total comprehensive income for the year 620.4 719.3<br />
Total comprehensive income attributable to<br />
Equity holders 621.6 719.3<br />
Divestments <strong>of</strong> shares –2.6 0.0<br />
Strategic divestments –2.1 0.0<br />
Non-controlling interests –1.2 0.0<br />
Net strategic investments/divestments –2.1 –8.0<br />
1 Of which in joint ventures and associated companies –20.7 –75.5<br />
Total net investments/divestments 257.2 164.4<br />
“Other comprehensive income for the year” amounted to <strong>USD</strong> 61.6 M<br />
(167.8). The change in translation differences attributable to equity<br />
holders totaled <strong>USD</strong> –51.6 M (–204.7). This item − which consists <strong>of</strong><br />
the change in accumulated translation differences when translating the<br />
financial reports <strong>of</strong> operations outside Sweden, as well as exchange rate<br />
differences that have arisen when hedging net investments in operations<br />
outside Sweden − mainly includes negative translation differences<br />
in currencies such as euros, Polish zloty and Czech korunas. About 30<br />
percent <strong>of</strong> net investments outside Sweden were currency hedged during<br />
<strong>2010</strong>, which contributed a positive effect <strong>of</strong> <strong>USD</strong> 14.9 M (–53.5) to<br />
“Other comprehensive income for the year”. See also Note 6.<br />
The effects <strong>of</strong> actuarial gains and losses on pensions totaled<br />
<strong>USD</strong> 123.3 M (99.8). This positive impact was due to higher discount<br />
rates and a return on pension plan assets that exceeded actuarial<br />
assumptions. The higher discount rates were primarily a consequence <strong>of</strong><br />
a new benchmark interest rate for <strong>Skanska</strong>’s Swedish pension liabilities.<br />
Effects <strong>of</strong> cash flow hedges amounted to <strong>USD</strong> 17.6 M (–52.1). Hedge<br />
accounting is applied primarily in the Infrastructure Development business<br />
stream and the operations <strong>of</strong> <strong>Skanska</strong> Poland. The item includes<br />
changes in unrealized gains and losses on hedging instruments. It<br />
included an unrealized loss <strong>of</strong> about <strong>USD</strong> –20.7 M related to fair value<br />
measurement <strong>of</strong> interest rate swaps from joint venture companies in<br />
Infrastructure Development operations, mainly in the U.K. Interest rate<br />
swaps are used for long-term hedging <strong>of</strong> interest expenses related to certain<br />
long-term Infrastructure Development projects.<br />
Unrealized gains related to currency swaps included about<br />
<strong>USD</strong> 37.7 M in Polish operations. Total comprehensive income for the<br />
year amounted to <strong>USD</strong> 620.4 M (719.3).<br />
Depreciation/amortization, non-current assets –180.5 –193.0<br />
The Group’s investments totaled <strong>USD</strong> –1,491.3 M (–1,231.0). Divestments<br />
totaled <strong>USD</strong> 1,748.5 M (1,395.4), and the Group’s net divestments<br />
amounted to <strong>USD</strong> 257.2 M (164.4).<br />
Investments in property, plant and equipment, which mainly consisted<br />
<strong>of</strong> continuous replacement investments in operations, amounted to<br />
<strong>USD</strong> –185.6 M (–166.3). Divestments <strong>of</strong> property, plant and equipment<br />
amounted to <strong>USD</strong> 33.3 M (52.4).<br />
Depreciation on property, plant and equipment amounted to<br />
<strong>USD</strong> –169.5 M (–182.4).<br />
Net divestments in current-asset properties amounted to<br />
<strong>USD</strong> 480.5 M (351.1). Projects were sold for <strong>USD</strong> 1,658.6 M (1,324.8),<br />
while investments amounted to <strong>USD</strong> –1,178.1 M (–973.3).<br />
In Residential Development, investments in current-asset properties<br />
amounted to <strong>USD</strong> –744.6 M (–406.8) and total investments amounted<br />
to <strong>USD</strong> –771.6 M (–448.2), <strong>of</strong> which about <strong>USD</strong> –260.3 M was related<br />
to acquisitions <strong>of</strong> land equivalent to 5,347 building rights. Completed<br />
homes were sold for <strong>USD</strong> 744.5 M (773.7).<br />
In Commercial Property Development, investments in current-asset<br />
properties amounted to <strong>USD</strong> –433.5 M (–567.0), and total investments<br />
amounted to <strong>USD</strong> –436.6 M (–561.7). Of this, <strong>USD</strong> –111.8 M was related<br />
to investments in land. Divestments <strong>of</strong> current-asset properties totaled<br />
<strong>USD</strong> 914.1 M (551.2). Net divestments <strong>of</strong> current-asset properties in<br />
Commercial Property Development amounted to <strong>USD</strong> 480.6 M (–15.8).<br />
Investments in the form <strong>of</strong> equity and subordinated loans in Infrastructure<br />
Development amounted to <strong>USD</strong> –96.0 M (–58.1). Divestments<br />
amounted to <strong>USD</strong> 55.9 M (17.9) and were related to the sale <strong>of</strong> <strong>Skanska</strong>’s<br />
50 percent stake in the Orkdalsvegen highway in Norway and repayment<br />
<strong>of</strong> subordinated loans from several projects. Net investments in<br />
Infrastructure Development totaled <strong>USD</strong> –40.1 M (–40.2).<br />
<strong>Skanska</strong> <strong>Review</strong> <strong>of</strong> <strong>2010</strong> – <strong>USD</strong> <strong>version</strong> Report <strong>of</strong> the Directors 73


