

Review of 2010 â USD version - Skanska
Review of 2010 â USD version - Skanska
Review of 2010 â USD version - Skanska

You also want an ePaper? Increase the reach of your titles
YUMPU automatically turns print PDFs into web optimized ePapers that Google loves.
Cash flow<br />
The Group’s operating cash flow<br />
<strong>USD</strong> M <strong>2010</strong> 2009<br />
Cash flow from business operations before change<br />
in working capital 628.2 729.0<br />
Change in working capital 6.7 52.7<br />
Net investments/divestments in the business 259.3 172.4<br />
Adjustments in payment dates <strong>of</strong> net investments –22.2 –2.0<br />
Taxes paid in business operations –229.6 –142.4<br />
Cash flow from business operations 642.3 809.6<br />
Net interest items and other financial items –8.6 –49.5<br />
Taxes paid in financial activities 2.6 13.6<br />
Cash flow from financial activities –6.0 –35.9<br />
Cash flow from operations 636.4 773.7<br />
Strategic net investments/divestments –2.1 –8.0<br />
Taxes paid on strategic divestments 0.0 0.0<br />
Cash flow from strategic investments –2.1 –8.0<br />
Dividend etc 1 –398.6 –332.5<br />
Cash flow before change in interest-bearing receivables<br />
and liabilities 235.7 433.2<br />
Change in interest-bearing receivables and liabilities –582.5 –211.3<br />
Cash flow for the year –346.8 221.9<br />
Cash and cash equivalents, January 1 1,309.0 1,020.5<br />
Exchange rate differences in cash and cash<br />
equivalents 15.9 66.6<br />
Cash and cash equivalents, December 31 978.1 1,309.0<br />
1 Of which repurchases <strong>of</strong> shares –35.0 –46.4<br />
Cash flow for the year amounted to <strong>USD</strong> –346.8 M (221.9). Reduced<br />
cash flows from a majority <strong>of</strong> the units in the Construction business<br />
stream as well as Residential Development contributed to the decrease<br />
in cash flow from business operations before change in working capital<br />
to <strong>USD</strong> 628.2 M (729.0). Tied-up working capital continued to decrease<br />
during the year, and the change amounted to <strong>USD</strong> 6.7 M (52.7).<br />
Overall, net divestments in business operations increased by<br />
<strong>USD</strong> 86.9 M to <strong>USD</strong> 259.3 M (172.4). The change in net divestments was<br />
primarily due to the fact that, in Commercial Property Development,<br />
during <strong>2010</strong> purchasers took possession <strong>of</strong> a number <strong>of</strong> properties that<br />
had been sold.<br />
Taxes paid in business operations amounted to <strong>USD</strong> 229.3 M (142.4).<br />
Dividends, repurchases <strong>of</strong> shares and adjustments <strong>of</strong> holdings to<br />
non-controlling interests amounted to <strong>USD</strong> –398.6 M (–332.5).<br />
Change in interest-bearing receivables and liabilities amounted to<br />
<strong>USD</strong> –582.5 M (–211.3). The change is mainly due to debt repayments.<br />
Cash flow for the year, <strong>USD</strong> –346.8 M (221.9), together with<br />
exchange rate differences <strong>of</strong> <strong>USD</strong> –15.9 M (–66.7) decreased cash and<br />
cash equivalents to <strong>USD</strong> 978.1 M (1,309.0).<br />
Financing and liquidity<br />
At year-end <strong>2010</strong>, the Group had interest-bearing net receivables,<br />
including provisions, amounting to <strong>USD</strong> 1,457.3 M (1,125.6). The<br />
Group’s unutilized credit facilities totaled <strong>USD</strong> 1,080.4 M (1,070.0) at<br />
year-end. Of these, <strong>USD</strong> 993.7 M was an unutilized long-term credit that<br />
runs through June 2014. The proportion <strong>of</strong> interest-bearing net assets<br />
in currencies other than SEK, after taking derivatives into account,<br />
decreased to 28 (38) percent. A large part <strong>of</strong> this decrease is attributable<br />
to increased net debt in EUR. Interest-bearing assets decreased to<br />
<strong>USD</strong> 2,182.1 M (2,193.9). Of these, receivables in currencies other than<br />
SEK accounted for 75 (67) percent. The average interest rate refixing<br />
period for all <strong>of</strong> the Group’s interest-bearing assets was 0.5 (0.1) years,<br />
and the interest rate amounted to 0.91 (0.63) percent at year-end.<br />
Change in interest-bearing assets and liabilities<br />
<strong>USD</strong> M <strong>2010</strong> 2009<br />
Net interest-bearing receivables, January 1 1,125.6 1,195.2<br />
Change in accounting principle –611.7<br />
Adjusted net interest-bearing receivables, January 1 1,125.6 583.5<br />
Cash flow from business operations 642.3 809.6<br />
Cash flow from financing activities excluding changes<br />
in interest-bearing liabilities and receivables –6.0 –35.9<br />
Cash Avkastning flow from på eget strategic och investments –2.1 –8.0<br />
sysselsatt kapital<br />
Dividend etc 1 –398.6 –332.5<br />
%<br />
Acquired/divested 30<br />
interest-bearing liabilities –0.6 0.0<br />
Exchange rate differences –22.0 4.7<br />
Change 25 in pension liability 105.4 90.2<br />
Reclassifications 0.0 29.7<br />
20<br />
Other changes 13.0 –15.5<br />
Net interest-bearing receivables, December 31 15<br />
1,457.3 1,125.6<br />
1 Of which repurchases <strong>of</strong> shares –35.0 –46.4<br />
10<br />
The Group’s interest-bearing liabilities and provisions decreased to<br />
<strong>USD</strong> 5 724.8 M (1,068.3), <strong>of</strong> which pension liabilities and provisions<br />
amounted to <strong>USD</strong> 185.9 M (318.9) and construction loans to cooperative<br />
0<br />
housing associations totaled <strong>USD</strong> 163.3 M (355.2). The average interest<br />
2006 2007 2008 2009 <strong>2010</strong><br />
rate refixing period, excluding pension liabilities, for all interest-bearing<br />
liabilities Avkastning på eget kapital<br />
was 0.9 (1.2) years, and the average maturity was 1.4 (1.9) years.<br />
• Avkastning på sysselsatt kapital<br />
The interest rate for all Group interest-bearing liabilities, excluding<br />
pension liabilities, amounted to 3.09 (3.65) percent at year-end.<br />
The Group’s total assets and liabilities/equity amounted to<br />
<strong>USD</strong> 11.4 (11.7) billion. Due to currency rate effects, the total decreased<br />
by <strong>USD</strong> 0.2 billion.<br />
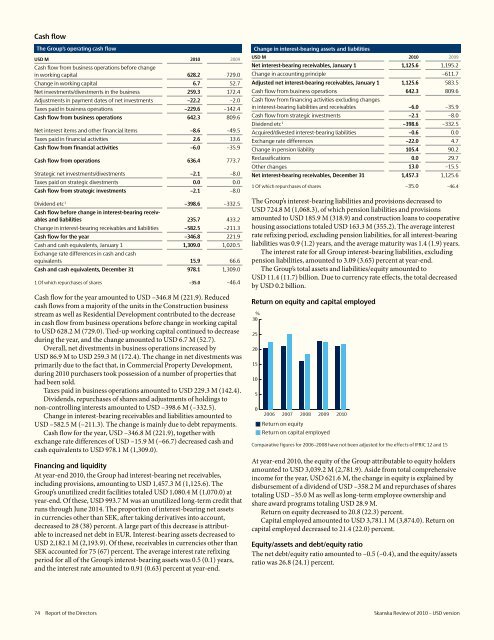
Return on equity and capital employed<br />
%<br />
30<br />
25<br />
20<br />
15<br />
10<br />
5<br />
0<br />
2006 2007 2008 2009 <strong>2010</strong><br />
Return on equity<br />
• Return on capital employed<br />
Comparative figures for 2006–2008 have not been adjusted for the effects <strong>of</strong> IFRIC 12 and 15<br />
At year-end <strong>2010</strong>, the equity <strong>of</strong> the Group attributable to equity holders<br />
amounted to <strong>USD</strong> 3,039.2 M (2,781.9). Aside from total comprehensive<br />
income for the year, <strong>USD</strong> 621.6 M, the change in equity is explained by<br />
disbursement <strong>of</strong> a dividend <strong>of</strong> <strong>USD</strong> –358.2 M and repurchases <strong>of</strong> shares<br />
totaling <strong>USD</strong> –35.0 M as well as long-term employee ownership and<br />
share award programs totaling <strong>USD</strong> 28.9 M.<br />
Return on equity decreased to 20.8 (22.3) percent.<br />
Capital employed amounted to <strong>USD</strong> 3,781.1 M (3,874.0). Return on<br />
capital employed decreased to 21.4 (22.0) percent.<br />
Equity/assets and debt/equity ratio<br />
The net debt/equity ratio amounted to –0.5 (–0.4), and the equity/assets<br />
ratio was 26.8 (24.1) percent.<br />
74 Report <strong>of</strong> the Directors <strong>Skanska</strong> <strong>Review</strong> <strong>of</strong> <strong>2010</strong> – <strong>USD</strong> <strong>version</strong>


