

Review of 2010 â USD version - Skanska
Review of 2010 â USD version - Skanska
Review of 2010 â USD version - Skanska

Create successful ePaper yourself
Turn your PDF publications into a flip-book with our unique Google optimized e-Paper software.
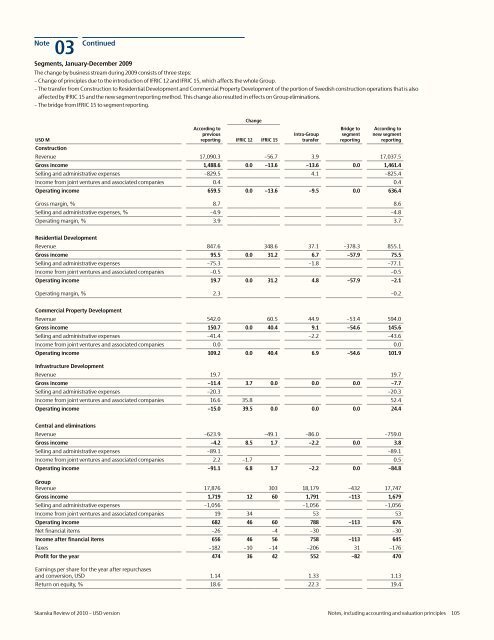
Note<br />
03 Continued<br />
Segments, January-December 2009<br />
The change by business stream during 2009 consists <strong>of</strong> three steps:<br />
– Change <strong>of</strong> principles due to the introduction <strong>of</strong> IFRIC 12 and IFRIC 15, which affects the whole Group.<br />
– The transfer from Construction to Residential Development and Commercial Property Development <strong>of</strong> the portion <strong>of</strong> Swedish construction operations that is also<br />
affected by IFRIC 15 and the new segment reporting method. This change also resulted in effects on Group eliminations.<br />
– The bridge from IFRIC 15 to segment reporting.<br />
<strong>USD</strong> M<br />
Change<br />
According to<br />
previous<br />
reporting IFRIC 12 IFRIC 15<br />
Intra-Group<br />
transfer<br />
Bridge to<br />
segment<br />
reporting<br />
According to<br />
new segment<br />
reporting<br />
Construction<br />
Revenue 17,090.3 –56.7 3.9 17,037.5<br />
Gross income 1,488.6 0.0 –13.6 –13.6 0.0 1,461.4<br />
Selling and administrative expenses –829.5 4.1 –825.4<br />
Income from joint ventures and associated companies 0.4 0.4<br />
Operating income 659.5 0.0 –13.6 –9.5 0.0 636.4<br />
Gross margin, % 8.7 8.6<br />
Selling and administrative expenses, % –4.9 –4.8<br />
Operating margin, % 3.9 3.7<br />
Residential Development<br />
Revenue 847.6 348.6 37.1 –378.3 855.1<br />
Gross income 95.5 0.0 31.2 6.7 –57.9 75.5<br />
Selling and administrative expenses –75.3 –1.8 –77.1<br />
Income from joint ventures and associated companies –0.5 –0.5<br />
Operating income 19.7 0.0 31.2 4.8 –57.9 –2.1<br />
Operating margin, % 2.3 –0.2<br />
Commercial Property Development<br />
Revenue 542.0 60.5 44.9 –53.4 594.0<br />
Gross income 150.7 0.0 40.4 9.1 –54.6 145.6<br />
Selling and administrative expenses –41.4 –2.2 –43.6<br />
Income from joint ventures and associated companies 0.0 0.0<br />
Operating income 109.2 0.0 40.4 6.9 –54.6 101.9<br />
Infrastructure Development<br />
Revenue 19.7 19.7<br />
Gross income –11.4 3.7 0.0 0.0 0.0 –7.7<br />
Selling and administrative expenses –20.3 –20.3<br />
Income from joint ventures and associated companies 16.6 35.8 52.4<br />
Operating income –15.0 39.5 0.0 0.0 0.0 24.4<br />
Central and eliminations<br />
Revenue –623.9 –49.1 –86.0 –759.0<br />
Gross income –4.2 8.5 1.7 –2.2 0.0 3.8<br />
Selling and administrative expenses –89.1 –89.1<br />
Income from joint ventures and associated companies 2.2 –1.7 0.5<br />
Operating income –91.1 6.8 1.7 –2.2 0.0 –84.8<br />
Group<br />
Revenue 17,876 303 18,179 –432 17,747<br />
Gross income 1,719 12 60 1,791 –113 1,679<br />
Selling and administrative expenses –1,056 –1,056 –1,056<br />
Income from joint ventures and associated companies 19 34 53 53<br />
Operating income 682 46 60 788 –113 676<br />
Net financial items –26 –4 –30 –30<br />
Income after financial items 656 46 56 758 –113 645<br />
Taxes –182 –10 –14 –206 31 –176<br />
Pr<strong>of</strong>it for the year 474 36 42 552 –82 470<br />
Earnings per share for the year after repurchases<br />
and con<strong>version</strong>, <strong>USD</strong> 1.14 1.33 1.13<br />
Return on equity, % 18.6 22.3 19.4<br />
<strong>Skanska</strong> <strong>Review</strong> <strong>of</strong> <strong>2010</strong> – <strong>USD</strong> <strong>version</strong> Notes, including accounting and valuation principles 105


