- Page 1 and 2:
MUNN'S NTRODUCTION TO FERNALD/FERNA
- Page 4 and 5:
INTRODUCTION TO Psychology L. DODGE
- Page 6:
List of Figures xv Acknowledgments
- Page 9 and 10:
viii Contents Part 2 The Human Orga
- Page 11 and 12:
Contents Part 4 Learning and Inform
- Page 13 and 14:
xii Contents Part 6 Individual Diff
- Page 15 and 16:
xiv Contents Part 8 Psychology and
- Page 17 and 18:
xvi List of Figures Figure 8.1 Lana
- Page 20 and 21:
As the reader Purely will decide, t
- Page 23:
A Journey
- Page 26 and 27:
Prologue Title Topic Source /. Psyc
- Page 28 and 29:
Prologue xxvii Like the response pa
- Page 30:
INTRODUCTION TO Psychology
- Page 35 and 36:
Background and Methods At mealtime
- Page 37 and 38:
Background and Methods Figure 1.2 T
- Page 39 and 40:
10 Background and Methods 'One spri
- Page 41 and 42:
12 Background and Methods It should
- Page 43 and 44:
14 Background and Methods James and
- Page 45 and 46:
16 Background and Methods Figure 1.
- Page 47 and 48:
18 Background and Methods Figure 1.
- Page 49 and 50:
20 Background and Methods Figure 1.
- Page 51 and 52:
22 Background and Methods 'Sitting
- Page 53 and 54:
24 Background and Methods Each of t
- Page 55 and 56:
26 Background and Methods Emergence
- Page 59 and 60:
30 Background and Methods "My mothe
- Page 61 and 62:
32 Background and Methods Collectin
- Page 63 and 64:
34 Background and Methods A related
- Page 65 and 66:
36 Background and Methods Figure 2.
- Page 67 and 68:
38 Background and Methods *l was on
- Page 69 and 70:
40 Background and Methods CLINICAL
- Page 71 and 72:
42 Background and Methods Psycholog
- Page 73 and 74:
Background and Methods Another trou
- Page 75 and 76:
46 Background and Methods Figure 2.
- Page 77 and 78:
48 Background and Methods When the
- Page 79 and 80:
50 Background and Methods RESEARCH
- Page 81 and 82:
52 Background and Methods Prior to
- Page 83 and 84:
54 Background and Methods Survey Me
- Page 89 and 90:
60 The Human Organism The study of
- Page 91 and 92:
62 The Human Organism Figure 3.4 In
- Page 93 and 94:
64 The Human Organism Figure 3.7 De
- Page 95 and 96:
66 The Human Organism The increased
- Page 97 and 98:
68 The Human Organism This totally
- Page 99 and 100:
Plate 2 Eight-Week-Old Fetus. In ju
- Page 101 and 102:
70 The Human Organism Sensorimotor
- Page 103 and 104:
72 The Human Organism The deprivati
- Page 105 and 106:
74 The Human Organism Figure 3.13 I
- Page 107 and 108:
76 The Human Organism The qualifica
- Page 109 and 110:
78 The Human Organism Figure 3.15 D
- Page 111 and 112:
80 The Human Organism Figure 3.17 A
- Page 113 and 114:
82 The Human Organism Transfer Grou
- Page 115 and 116:
84 The Human Organism INDIVIDUAL DI
- Page 117 and 118:
86 The Human Organism Heredity and
- Page 120 and 121:
fftgtepoiitfHf ДОИ* * L» i-'"-,
- Page 122 and 123:
Physiology and Behavior 91 Figure 4
- Page 124 and 125:
Physiology and Behavior 93 —f Res
- Page 126 and 127:
Physiology and Behavior 95 Figure 4
- Page 128 and 129:
Physiology and Behavior 97 Receptor
- Page 130 and 131:
Physiology and Behavior 99 Motor Pr
- Page 132 and 133:
Physiology and Behavior 101 Nonsens
- Page 134 and 135:
.,••. ь • • : • ; •
- Page 136 and 137:
Physiology and Behavior 105 On this
- Page 138 and 139:
Physiology and Behavior 107 Lung He
- Page 140 and 141:
Physiology and Behavior 109 part of
- Page 142 and 143:
Physiology and Behavior 111 One fun
- Page 144 and 145:
Physiology and Behavior 113 Figure
- Page 146 and 147:
Physiology and Behavior 115 Subcort
- Page 149 and 150:
•'л§ а- 1 : '•:£•* a i'A
- Page 153 and 154:
122 Modes of Awareness In this chap
- Page 155 and 156:
124 Modes of Awareness *James Bond
- Page 157 and 158:
126 Modes of Awareness TRADITIONAL
- Page 159 and 160:
128 Modes of Awareness Figure 5.5 T
- Page 161 and 162:
130 Modes of Awareness *l knew a gu
- Page 163 and 164:
132 Modes of Awareness Figure 5.8 C
- Page 165 and 166:
Plate 6 Retinal Color Zones. This c
- Page 167 and 168:
134 Modes of Awareness whereas the
- Page 169 and 170:
136 Modes of Awareness -J- Hair Fre
- Page 171 and 172:
138 Modes of Awareness Figure 5.13
- Page 173 and 174:
140 Modes of Awareness 'I've often
- Page 175 and 176:
142 Modes of Awareness the light ea
- Page 177 and 178:
144 Modes of Awareness 5. The stimu
- Page 179 and 180:
K^^rT, •. -Y - w* 7 r< - ч. 3i>.
- Page 181 and 182:
148 Modes of Awareness The boy's ar
- Page 183 and 184:
150 Modes of Awareness Stimulus Cha
- Page 185 and 186:
152 Modes of Awareness Figure 6.3 I
- Page 187 and 188:
1S4 Modes of Awareness L \ С Figur
- Page 189 and 190:
156 Modes of Awareness MAKING AN IN
- Page 191 and 192:
158 Modes of Awareness 'When I was
- Page 193 and 194:
160 Modes of Awareness The same sor
- Page 195 and 196:
162 Modes of Awareness Figure 6.15
- Page 197 and 198:
164 Modes of Awareness Achieving an
- Page 199 and 200:
166 Modes of Awareness Altogether,
- Page 201 and 202:
168 Modes of Awareness Figure 6.19
- Page 203 and 204:
170 Modes of Awareness A most impor
- Page 205 and 206:
172 Modes of Awareness 7. An illusi
- Page 207:
,_•,„-:..&и';#&*•;,. 77:^7
- Page 210 and 211:
7 Learning as Conditioning CLASSICA
- Page 212 and 213:
Learning as Conditioning 179 Classi
- Page 214 and 215:
Learning as Conditioning 181 Consid
- Page 216 and 217:
Learning as Conditioning 183 the cl
- Page 218 and 219:
Learning as Conditioning 185 Pavlov
- Page 220 and 221:
Learning as Conditioning 187 A food
- Page 222 and 223:
Learning as Conditioning 189 hours,
- Page 224 and 225:
Learning as Conditioning 191 1,000
- Page 226 and 227:
Learning as Conditioning 193 Extern
- Page 228 and 229:
Learning as Conditioning 195 The or
- Page 230 and 231:
Learning as Conditioning 197 This v
- Page 232:
Learning as Conditioning 199 Critic
- Page 235 and 236:
202 Learning and Information Proces
- Page 237 and 238:
204 Learning and Information Proces
- Page 239 and 240:
206 Learning and Information Proces
- Page 241 and 242:
208 Learning and Information Proces
- Page 243 and 244:
210 Learning and Information Proces
- Page 245 and 246:
212 Learning and Information Proces
- Page 247 and 248:
214 Learning and Information Proces
- Page 249 and 250:
216 Learning and Information Proces
- Page 251 and 252:
218 Learning and Information Proces
- Page 253 and 254:
220 Learning and Information Proces
- Page 255 and 256:
222 Learning and Information Proces
- Page 257 and 258:
224 Learning and Information Proces
- Page 259 and 260:
226 Learning and Information Proces
- Page 261:
228 Learning and Information Proces
- Page 264 and 265:
Memory Rote Mnembiifc'fievices iMRn
- Page 266 and 267:
Memory 233 which in this case were
- Page 268 and 269:
Memory 235 Reappearance Hypothesis
- Page 270 and 271:
Memory 237 Method of Recognition If
- Page 272 and 273:
Memory 239 Images in the Sensjry Sy
- Page 274 and 275:
Memory 241 In this sense Harold Bur
- Page 276 and 277:
Memory 243 Depth of processing is n
- Page 278 and 279:
Plate 9 Structure of DNA. The disco
- Page 280 and 281:
Memory 245 Figure 9.10 Decay Theory
- Page 282 and 283:
Memory 247 Figure 9.12 Interference
- Page 284 and 285:
Memory 249 Repressive Forgetting Ou
- Page 286 and 287:
Memory 251 Type of Passage Original
- Page 288 and 289:
Memory 253 Figure 9.18 Overlearning
- Page 290 and 291:
Memory 255 Memory trace Physiologic
- Page 292 and 293:
Memory 257 10. Forgetting apparentl
- Page 294 and 295:
- " - • ~ and Instruction . p Of
- Page 296 and 297:
Learning and Instruction 261 After
- Page 298 and 299:
Learning and Instruction 263 For th
- Page 300 and 301:
Learning and Instruction 265 Figure
- Page 302 and 303:
Learning and Instruction 267 Figure
- Page 304 and 305:
Learning and Instruction 269 1. Stu
- Page 306 and 307:
Learning and Instruction 271 domain
- Page 308 and 309:
— Learning and Instruction 273 d>
- Page 310 and 311:
Learning and Instruction 275 Figure
- Page 312 and 313:
Learning and Instruction 277 Useful
- Page 314 and 315:
Learning and Instruction 279 cube,
- Page 316 and 317:
Learning and Instruction 281 10. Th
- Page 319 and 320:
d l Robin's Voyage ••-,-й . я
- Page 321 and 322:
286 Motivation and Emotion Robin's
- Page 323 and 324:
288 Motivation and Emotion Figure 1
- Page 325 and 326:
290 Motivation and Emotion Robin al
- Page 327 and 328:
292 Motivation and Emotion Species
- Page 329 and 330:
294 Motivation and Emotion Figure 1
- Page 331 and 332:
296 Motivation and Emotion Method o
- Page 333 and 334:
298 Motivation and Emotion Cellular
- Page 335 and 336:
300 MotivatiO7i and Emotion *' v
- Page 337 and 338:
302 Motivation and Emotion Figure 1
- Page 339 and 340:
304 Motivation and Emotion Social I
- Page 341 and 342:
306 Motivation and Emotion Critique
- Page 343 and 344:
308 Motivation and Emotion Figure 1
- Page 345 and 346:
310 Motivation and Emotion 3. As on
- Page 347 and 348:
Together i^lf*
- Page 349 and 350:
314 Motivation and Emotion Stephen
- Page 351 and 352:
316 Motivation and Emotion *We all
- Page 353 and 354:
318 Motivation and Emotion Figure 1
- Page 355 and 356:
320 Motivation and Emotion 'Last Sa
- Page 357 and 358:
322 Motivation and Emotion "This st
- Page 359 and 360:
324 Motivation and Emotion Figure 1
- Page 361 and 362:
326 Motivation and Emotion of neigh
- Page 363 and 364:
328 Motivation and Emotion Here aga
- Page 365 and 366:
330 Motivation and Emotion Figure 1
- Page 367 and 368:
332 Motivation and Emotion ;...•>
- Page 369 and 370:
334 Motivation and Emotion 14 Figur
- Page 371 and 372:
336 Motivation and Emotion Figure 1
- Page 373 and 374:
338 Motivation and Emotion Summary
- Page 375:
340 Motivation and Emotion Critical
- Page 378 and 379:
г -' -'-"i-i-г- • * * • -!*'
- Page 380 and 381:
METHODS OF Early Development» Со
- Page 382 and 383:
Tests and Measurement 347 Early Dev
- Page 384 and 385:
Tests and Measurement 349 Figure 13
- Page 386 and 387:
Tests and Measurement 351 1. Will y
- Page 388 and 389:
Tests and Measurement 353 General K
- Page 390 and 391:
Tests and Measurement 355 Weights H
- Page 392 and 393:
Plate11 Testing Spatial Relations A
- Page 394 and 395:
1 .•• Tests and Measurement 357
- Page 396 and 397:
Tests and Measurement 359 The pisto
- Page 398 and 399:
Tests and Measurement 361 Norm-Refe
- Page 400 and 401:
Tests and Measurement 363 Evaluatio
- Page 402 and 403:
Tests and Measurement 365 Summary M
- Page 406 and 407:
Intelligence "tiEMSOHEMENT OFINTELL
- Page 408 and 409:
Intelligence 371 Binet's Early Scal
- Page 410 and 411:
Intelligence 373 But any complex so
- Page 412 and 413:
Intelligence 375 Figure 14.8 Struct
- Page 414 and 415:
Intelligence 377 Terman and Goddard
- Page 416 and 417:
Intelligence 379 Goddard completely
- Page 418 and 419:
Intelligence 381 With regard to phy
- Page 420 and 421:
Intelligence 383 ORIGINS OF INTELLI
- Page 422 and 423:
Intelligence 385 Figure 14.16 Exami
- Page 424 and 425:
Intelligence 387 Both factors are a
- Page 426 and 427:
Intelligence 389 CD 8 6.4 6.2 60 I
- Page 428 and 429:
Intelligence 391 This commentary, f
- Page 430:
Intelligence 393 8. Surveys have sh
- Page 434 and 435:
Personality THEORY OF PSYCHOANALYSI
- Page 436 and 437:
Personality 399 Figure 15.2 Fraud i
- Page 438 and 439:
Personality 401 Figure 15.4 Imitati
- Page 440 and 441:
Personality 403 Jenny's Unconscious
- Page 442 and 443:
Personality 405 Figure 15.6 Project
- Page 444 and 445:
Personality 407 thus offers greater
- Page 446 and 447:
Personality 409 Figure 15.8 A Lette
- Page 448 and 449:
Personality 411 LEARNING THEORY Aft
- Page 450 and 451:
Personality 413 Vicarious Reinforce
- Page 452 and 453:
Personality 415 is a function of S-
- Page 454 and 455:
Personality 417 Person-Centered App
- Page 456 and 457:
Personality 419 incongruence should
- Page 458 and 459:
Plate 15 Adjustment as a Continuous
- Page 460 and 461:
Personality 421 This approach somet
- Page 462:
Personality 423 Critical Terms Pers
- Page 466 and 467:
Adjustment and Maladjustment 427 PR
- Page 468 and 469:
Adjustment and Maladjustment 429 -
- Page 470 and 471:
Adjustment and Maladjustment 431 Av
- Page 472 and 473:
Adjustment and Maladjustment 433 Ag
- Page 474 and 475:
Adjustment and Maladjustment 435 Co
- Page 476 and 477:
Adjustment and Maladjustment 437 In
- Page 478 and 479:
Adjustment and Maladjustment 439 Fi
- Page 480 and 481:
Adjustment and Maladjustment 441 Ac
- Page 482 and 483:
Adjustment and Maladjustment 443 Fi
- Page 484 and 485:
Adjustment and Maladjustment 445 Ma
- Page 486 and 487:
Adjustment and Maladjustment 447 En
- Page 488 and 489:
Adjustment and Maladjustment 449 Fi
- Page 490 and 491:
Adjustment and Maladjustment 451 Si
- Page 492 and 493:
Adjustment and Maladjustment 453 13
- Page 494 and 495:
" *•. i" 'A *-t) V .c | to his д
- Page 496 and 497:
Therapy 457 But alcohol was only an
- Page 498 and 499:
Therapy 459 f-V '" ..;••*•:
- Page 500 and 501:
Therapy 461 merit, using somewhat d
- Page 502 and 503:
Therapy 463 T: "You did. You must h
- Page 504 and 505:
Therapy 465 A basic procedure in lo
- Page 506 and 507:
Therapy 467 Examination hierarchy 1
- Page 508 and 509:
Therapy 469 the food itself. Or may
- Page 510 and 511:
Therapy 471 Figure 17.12 Boxing and
- Page 512 and 513:
Therapy 473 Figure 17.14 JW's Mood
- Page 514 and 515: Therapy 475 Influence of Drugs Drug
- Page 516 and 517: Therapy 477 Problems in Measuring C
- Page 518 and 519: Therapy 479 The extent to which any
- Page 520 and 521: Therapy 481 2. In person-centered c
- Page 522 and 523: Therapy 483 Suggested Readings Belk
- Page 527 and 528: 488 Psychology and Society These pe
- Page 529 and 530: 490 Psychology and Society Changing
- Page 531 and 532: 492 Psychology and Society Figure 1
- Page 533 and 534: 494 Psychology and Society In any r
- Page 535 and 536: 496 Psychology and Society INTERPER
- Page 537 and 538: 498 Psychology and Society Figure 1
- Page 539 and 540: 500 Psychology and Society 30 Figur
- Page 541 and 542: 502 Psychology and Society Figure 1
- Page 543 and 544: 504 Psychology and Society Figure 1
- Page 545 and 546: 506 Psychology and Society 'A situa
- Page 547 and 548: 508 Psychology and Society petition
- Page 549 and 550: 510 Psychology and Society terror i
- Page 551 and 552: 512 Psychology and Society Summary
- Page 555 and 556: 516 Psychology and Society Figure 1
- Page 557 and 558: 518 Psychology and Society This pro
- Page 559 and 560: 520 Psychology and Society Figure 1
- Page 561 and 562: 522 Psychology and Society Figure 1
- Page 563: 524 Psychology and Society METHODS
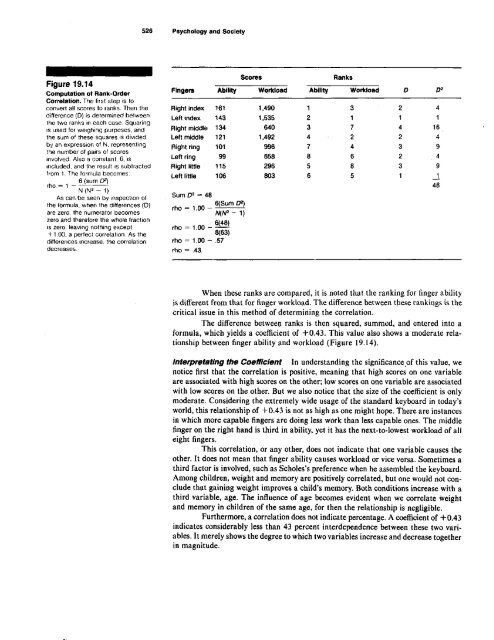
- Page 567 and 568: 528 Psychology and Society Row Figu
- Page 569 and 570: 530 Psychology and Society Study of
- Page 571 and 572: 532 Psychology and Society The quan
- Page 573: 534 Psychology and Society Cross Re
- Page 577 and 578: 538 Psychology and Society We begin
- Page 579 and 580: 540 Psychology and Society To find
- Page 581 and 582: 542 Psychology and Society Another
- Page 583 and 584: 544 Psychology and Society LAW AND
- Page 585 and 586: 546 Psychology and Society Figure 2
- Page 587 and 588: 648 Psychology and Society Research
- Page 589 and 590: 550 Psychology and Society Rank the
- Page 591 and 592: 552 Psychology and Society Figure 2
- Page 593 and 594: 554 Psychology and Society Architec
- Page 595 and 596: 556 Psychology and Society Figure 2
- Page 597 and 598: 558 Psychology and Society Televisi
- Page 599 and 600: 560 Psychology and Society Summary
- Page 602 and 603: •*. -V . |Epiloguer* Psychology i
- Page 604: Epilogue 565 Figure E.2 Research in
- Page 607 and 608: 568 Glossary affective state* A psy
- Page 609 and 610: 570 Glossary avoidance-avoidance co
- Page 611 and 612: 572 Glossary Clever Hans phenomenon
- Page 613 and 614: 574 Glossary consolidation theory A
- Page 615 and 616:
576 Glossary dependent variable An
- Page 617 and 618:
578 Glossary electroconvulsive ther
- Page 619 and 620:
580 Glossary fixed ratio reinforcem
- Page 621 and 622:
582 Glossary higher-order condition
- Page 623 and 624:
584 Glossary intensity The quantita
- Page 625 and 626:
586 Glossary Likert method An attit
- Page 627 and 628:
588 Glossary motor Pertaining to mu
- Page 629 and 630:
590 Glossary operations In the stru
- Page 631 and 632:
592 Glossary phobic disorder A stro
- Page 633 and 634:
594 Glossary psychoanalysis A syste
- Page 635 and 636:
596 Glossary relative movement in p
- Page 637 and 638:
598 Glossary self-reinforcement sch
- Page 639 and 640:
600 Glossary special classes An app
- Page 641 and 642:
602 Glossary telegraphic utterances
- Page 643 and 644:
604 Glossary variable A changeable
- Page 645 and 646:
606 References Bahrick, L. E., Walk
- Page 647 and 648:
608 References Cappon, D., & Banks,
- Page 649 and 650:
610 References Eysenck, H. J., & Ka
- Page 651 and 652:
612 References Guilford, J. P. (197
- Page 653 and 654:
614 References Jensen, A. R' (1969)
- Page 655 and 656:
616 References Limber, J. (1977). L
- Page 657 and 658:
618 References Moore, В. S. Underw
- Page 659 and 660:
620 References Roethlisberger, F. J
- Page 661 and 662:
622 References Skeels, H. M. (1973)
- Page 663 and 664:
624 References Van Gogh, V. (1888).
- Page 666 and 667:
life -"**. - _ T • is * * 4 = * i
- Page 668 and 669:
Credits 629 Chapter 3 Figure 3.4 Fr
- Page 670 and 671:
Name Index Aarons. L, 272 Abdel-Hal
- Page 672 and 673:
Index 633 Hirvonen. M. D., 295 Hitl
- Page 674:
Index 635 Sladen, W. J. L, 33 Slate
- Page 677 and 678:
638 Index California Personality In
- Page 679 and 680:
640 Index intelligence quotient (!Q
- Page 681 and 682:
642 Index reaction formation, 434 r