- Page 1:
Business Case for the Sunshine Coas
- Page 4 and 5:
Business Case for the Sunshine Coas
- Page 6 and 7:
Business Case for the Sunshine Coas
- Page 8 and 9:
Business Case for the Sunshine Coas
- Page 10 and 11:
Business Case for the Sunshine Coas
- Page 12 and 13:
Business Case for the Sunshine Coas
- Page 14 and 15:
Business Case for the Sunshine Coas
- Page 16 and 17:
Business Case for the Sunshine Coas
- Page 18 and 19:
Business Case for the Sunshine Coas
- Page 20 and 21:
Business Case for the Sunshine Coas
- Page 22 and 23:
0 60 120 240 360 480 600 Meters Whi
- Page 24 and 25:
Business Case for the Sunshine Coas
- Page 26 and 27:
Business Case for the Sunshine Coas
- Page 28 and 29:
Business Case for the Sunshine Coas
- Page 30 and 31:
Business Case for the Sunshine Coas
- Page 32 and 33:
Business Case for the Sunshine Coas
- Page 34 and 35:
Business Case for the Sunshine Coas
- Page 36 and 37:
Business Case for the Sunshine Coas
- Page 38 and 39:
Business Case for the Sunshine Coas
- Page 40 and 41:
Business Case for the Sunshine Coas
- Page 42 and 43:
Business Case for the Sunshine Coas
- Page 44 and 45:
Business Case for the Sunshine Coas
- Page 46 and 47:
Sunshine Coast Airport Master Plan
- Page 48 and 49:
Acknowledgement This Master Plan ha
- Page 50 and 51:
1 Executive Summary 1.1 Introductio
- Page 52 and 53:
1.6 Peak Stand Demand FIGURE 1-3 BU
- Page 54 and 55:
TABLE 1-2 PARKING DEMAND FORECAST Y
- Page 56 and 57:
1.12 2020 Master Plan A layout show
- Page 58 and 59:
1 Introduction 1.1 Sunshine Coast A
- Page 60 and 61:
723 submissions were received from
- Page 62 and 63:
2 Aviation Demand Forecast 2.1 Hist
- Page 64 and 65:
FIGURE 2-3 HISTORIC AND FORECAST AN
- Page 66 and 67:
FIGURE 2-6 HISTORIC AND FORECAST AN
- Page 68 and 69:
2.5 Peak Stand Demand Peak stand de
- Page 70 and 71:
FIGURE 3-1 RPT APRON LAYOUT 3.3.2 G
- Page 72 and 73:
4 Passenger Terminal 4.1 Terminal T
- Page 74 and 75:
FIGURE 4-1 2020 TERMINAL LAYOUT CON
- Page 76 and 77:
access road is constructed the airp
- Page 78 and 79:
6 Runways 6.1 Existing Facilities S
- Page 80 and 81:
The public consultation which accom
- Page 82 and 83:
7 Taxiways 7.1 Runway 18/36 Taxiway
- Page 84 and 85:
Sunshine Coast Airport has recently
- Page 86 and 87:
FIGURE 8-1 AVIATION SUPPORT FACILIT
- Page 88 and 89:
9 Master Plan 9.1 2020 Master Plan
- Page 90 and 91:
10 Environmental Impacts 10.1 Aircr
- Page 92 and 93:
Arrivals, departures and training c
- Page 94 and 95:
♦ Figure 10-2 : 2025 New Runway 1
- Page 96 and 97:
10.1.8 Flight Path Movement Chart I
- Page 98 and 99:
Boronia rosmarinifolia Eucalyptus c
- Page 100 and 101:
FIGURE 10-8 OBSTACLE LIMITATION SUR
- Page 102 and 103:
Development Commence detailed studi
- Page 104 and 105:
Appendices Appendix A - Schedule of
- Page 106 and 107:
Date Organisation Position 28-04-05
- Page 108 and 109:
Appendix B - SCA Public Participati
- Page 110 and 111:
A media relations campaign was also
- Page 112 and 113:
appendix b Project Implementation S
- Page 114 and 115:
New Runway Project Strategy Documen
- Page 116 and 117:
New Runway Project Strategy Glossar
- Page 118 and 119:
New Runway Project Strategy Table o
- Page 120 and 121:
New Runway Project Strategy Executi
- Page 122 and 123:
New Runway Project Strategy Milesto
- Page 124 and 125:
New Runway Project Strategy Feasibi
- Page 126 and 127:
New Runway Project Strategy Project
- Page 128 and 129:
New Runway Project Strategy 1. Intr
- Page 130 and 131:
New Runway Project Strategy 2.4.2.
- Page 132 and 133:
New Runway Project Strategy obligat
- Page 134 and 135:
New Runway Project Strategy 2.10. F
- Page 136 and 137:
New Runway Project Strategy 3. New
- Page 138 and 139:
New Runway Project Strategy 3.6. As
- Page 140 and 141:
New Runway Project Strategy 3.9.1.
- Page 142 and 143:
New Runway Project Strategy 4. Stak
- Page 144 and 145:
New Runway Project Strategy 5. Feas
- Page 146 and 147:
New Runway Project Strategy 6. Work
- Page 148 and 149:
New Runway Project Strategy 7. Proj
- Page 150 and 151:
New Runway Project Strategy 8. Proj
- Page 152 and 153:
New Runway Project Strategy Council
- Page 154 and 155:
New Runway Project Strategy o New b
- Page 156 and 157:
New Runway Project Strategy 9.4. Fo
- Page 158 and 159:
New Runway Project Strategy 10.7. R
- Page 160 and 161:
New Runway Project Strategy Vol X.0
- Page 162 and 163:
New Runway Project Strategy 12. Pro
- Page 164 and 165:
New Runway Project Strategy 13.5. R
- Page 166 and 167:
New Runway Project Strategy preferr
- Page 168 and 169:
Appendix 1 to Sunshine Coast Airpor
- Page 170 and 171:
Appendix 2 to Sunshine Coast Airpor
- Page 172 and 173:
Appendix 3 to Sunshine Coast Airpor
- Page 174 and 175:
Appendix 5 to Sunshine Coast Airpor
- Page 176 and 177:
Appendix 7 to Sunshine Coast Airpor
- Page 178 and 179:
Sunshine Coast Airport Traffic Fore
- Page 180 and 181:
10. Glossary.......................
- Page 182 and 183:
2 2. Sunshine Coast Airport Traffic
- Page 184 and 185:
4 Table 2.1: Sunshine Coast Airport
- Page 186 and 187:
6 2.3 Current Airline Services As a
- Page 188 and 189:
8 3. Forecast Approach & Review of
- Page 190 and 191:
Australian aviation has not felt th
- Page 192 and 193:
In its review of possible strongly
- Page 194 and 195:
14 • Qantas Group firm orders red
- Page 196 and 197:
16 • Melbourne-Shanghai services
- Page 198 and 199:
In the IVS and NVS the ‘Sunshine
- Page 200 and 201:
20 • The Sunshine Coast’s labou
- Page 202 and 203:
22 5. Forecast Scenarios and Outcom
- Page 204 and 205:
24 o New Asian route(s) added leadi
- Page 206 and 207:
Figure 5.1 presents the passenger m
- Page 208 and 209:
28 6. Busy Hour Analysis 6.1 Review
- Page 210 and 211:
30 Seats/Aircraft: Table 6.3: Busy
- Page 212 and 213:
32 Table 7.2: Sunshine Coast Gross
- Page 214 and 215:
34 8.2 Current Airline Routes and F
- Page 216 and 217:
36 9. Attachment 3: Potential Impac
- Page 218 and 219: 38 10. Glossary Data Sourced from t
- Page 220 and 221: 40 DISCLAIMER The Forecasts describ
- Page 222: Sunshine Coast Airport Airport Mast
- Page 227 and 228: 1 Executive Summary
- Page 229 and 230: Executive Summary The types of econ
- Page 231 and 232: 2 Background
- Page 233 and 234: Background 2.2 Contract requirement
- Page 235 and 236: Background Sunshine Coast Airport P
- Page 237 and 238: Approach and methodology 3.1 Overvi
- Page 239 and 240: Approach and methodology 3.2 Method
- Page 241 and 242: Approach and methodology 3.3 Method
- Page 243 and 244: Approach and methodology Components
- Page 245 and 246: Approach and methodology Components
- Page 247 and 248: Approach and methodology 3.4.4 Othe
- Page 249 and 250: Approach and methodology 3.5 Method
- Page 251 and 252: Results and discussion 4.1 Overview
- Page 253 and 254: Results and discussion 10,000 Passe
- Page 255 and 256: Results and discussion PV Revenue -
- Page 257 and 258: The NPVs for each of the precincts
- Page 259 and 260: Results and discussion 4.4 Economic
- Page 261 and 262: Results and discussion PV monetised
- Page 263 and 264: Results and discussion Indirect emp
- Page 265 and 266: Results and discussion 4.5 Consolid
- Page 267: Results and discussion 4.5.1 Result
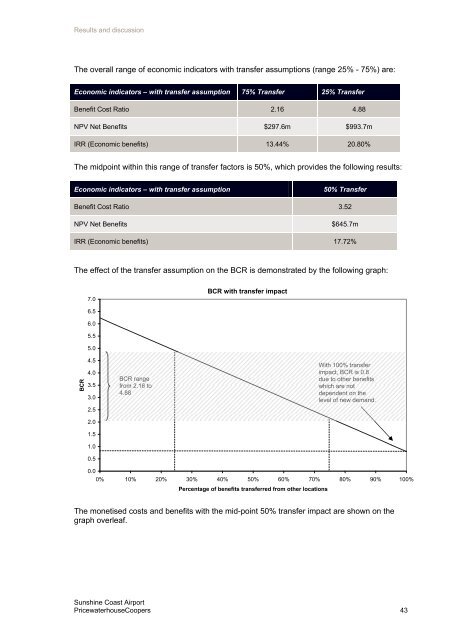
- Page 271 and 272: Results and discussion Economic ind
- Page 273 and 274: Results and discussion Alternative
- Page 275 and 276: 5 Conclusions and recommendations
- Page 277: Appendices
- Page 280 and 281: Appendix B Key assumptions NOT FOR
- Page 282 and 283: Appendix D Demand Summary NOT FOR P
- Page 284 and 285: pwc.com.au © 2009 PricewaterhouseC
- Page 286 and 287: 0 2.5 5 10 15 20 Kilometers 1 cm =
- Page 288 and 289: appendix f Infrastructure Australia
- Page 291 and 292: INFRASTRUCTURE AUSTRALIA REFORM AND
- Page 293 and 294: ü Build on Australias global compe
- Page 295 and 296: Stage 1: Goal Definition national a
- Page 297 and 298: Stage 1: Goal Definition which is i
- Page 299 and 300: Stage 1: Goal Definition and operat
- Page 301 and 302: Stage 2 and 3: Problem Identificati
- Page 303 and 304: Stage 2 and 3: Problem Identificati
- Page 305 and 306: Stage 4: Problem Analysis Outline t
- Page 307 and 308: Stage 5: Option Generation The Bris
- Page 309 and 310: Stage 5: Option Generation Convenie
- Page 311 and 312: Stage 5: Option Generation vii. inc
- Page 313 and 314: Stage 5: Option Generation charges
- Page 315 and 316: INFRASTRUCTURE AUSTRALIA REFORM AND
- Page 317 and 318: DETAILED APPRAISAL This section set
- Page 319 and 320:
Cost Estimation The capital and ope
- Page 321 and 322:
A risk assessment should be underta
- Page 323 and 324:
Non-Monetised Benefits and Costs Th
- Page 325 and 326:
Discounted airfares provided by low
- Page 327 and 328:
30m wide runway. SCA is one of four
- Page 329 and 330:
SCA is included in the regional pla
- Page 331 and 332:
SCRC’s draft economic development
- Page 333 and 334:
Key directions to guide the prepara
- Page 335 and 336:
It is estimated that the current te
- Page 337 and 338:
· $143m for other Master Plan proj
- Page 339 and 340:
Operating costs have not been indep
- Page 341 and 342:
The number of passenger hours saved
- Page 343 and 344:
Airline savings are calculated usin
- Page 345 and 346:
Incremental expenditure is calculat
- Page 347 and 348:
23 | P a g e KEY ASSUMPTIONS UNDERP
- Page 349 and 350:
Appraisal Summary Table 2 MONETISED
- Page 351 and 352:
Incremental returns from leased pre
- Page 353 and 354:
Savings from avoided out-bound dela
- Page 355 and 356:
As noted above, all outputs for the
- Page 357 and 358:
6 | P a g e Airline savings from av
- Page 359 and 360:
Sensitivity test # Variation Benefi
- Page 361 and 362:
Appraisal Summary Table 4 NON-MONET
- Page 363 and 364:
Appraisal Summary Table 5 INFORMATI
- Page 365 and 366:
DELIVERABILITY ASSESSMENT Criteria
- Page 367 and 368:
DELIVERABILITY ASSESSMENT time, as
- Page 369:
DELIVERABILITY ASSESSMENT 5.Does th