Notes to the financial statements(Expressed in millions of RMB, unless otherwise stated)58 Operating segmentsThe Group has presented the operating segments in a manner consistent with the way in which information is reported internally to theGroup’s chief operating decision makers for the purposes of resource allocation and performance assessment. Measurement of segmentassets and liabilities and segment income and results is based on the Group’s accounting policies.Transactions between segments are conducted under normal commercial terms and conditions. Internal charges and transfer prices aredetermined with reference to market rates and have been reflected in the performance of each segment. Net interest income and expensearising from internal charges and transfer pricing adjustments are referred to as “internal net interest income/expense”. Interest income andexpense earned from third parties are referred to as “external net interest income/expense”.Segment revenues, results, assets and liabilities include items directly attributable to a segment as well as those that can be allocated ona reasonable basis. Segment income and results are determined before intra-group transactions are eliminated as part of the consolidationprocess. Segment capital expenditure is the total cost incurred during the period to acquire fixed assets, intangible assets and otherlong-term assets.(1) Geographical segmentsThe Group operates principally in Mainland China with branches covering all provinces, autonomous regions and municipalitiesdirectly under the central government, and several subsidiaries located in Mainland China. The Group also has bank branchoperations in Hong Kong, Singapore, Frankfurt, Johannesburg, Tokyo, Seoul, New York, Sydney and Ho Chi Minh City and certainsubsidiaries operations in Hong Kong and London.In presenting information on the basis of geographical segments, operating income is allocated based on the location of thebranches and subsidiaries that generate the income. Segment assets, liabilities and capital expenditure are allocated based on theirgeographical location.Geographical segments of the Group, as defined for management reporting purposes, are defined as follows:– “Yangtze River Delta” refers to the following areas where the tier-1 branches and the subsidiaries of the Bank operate:Shanghai Municipality, Jiangsu Province, Zhejiang Province, City of Ningbo and City of Suzhou;– “Pearl River Delta” refers to the following areas where the tier-1 branches of the Bank operate: Guangdong Province, City ofShenzhen, Fujian Province and City of Xiamen;– “Bohai Rim” refers to the following areas where the tier-1 branches and the subsidiaries of the Bank operate: BeijingMunicipality, Shandong Province, Tianjin Municipality, Hebei Province and City of Qingdao;– the “Central” region refers to the following areas where the tier-1 branches and the subsidiaries of the Bank operate: ShanxiProvince, Guangxi Autonomous Region, Hubei Province, Henan Province, Hunan Province, Jiangxi Province, Hainan Province,Anhui Province and the Three Gorges Area;– the “Western” region refers to the following areas where the tier-1 branches and the subsidiaries of the Bank operate:Sichuan Province, Chongqing Municipality, Guizhou Province, Yunnan Province, Tibet Autonomous Region, Inner MongoliaAutonomous Region, Shaanxi Province, Gansu Province, Qinghai Province, Ningxia Autonomous Region and XinjiangAutonomous Region; and– the “Northeastern” region refers to the following areas where the tier-1 branches and the subsidiaries of the Bank operate:Liaoning Province, Jilin Province, Heilongjiang Province and City of Dalian.China Construction Bank Corporation annual report <strong>2012</strong>155
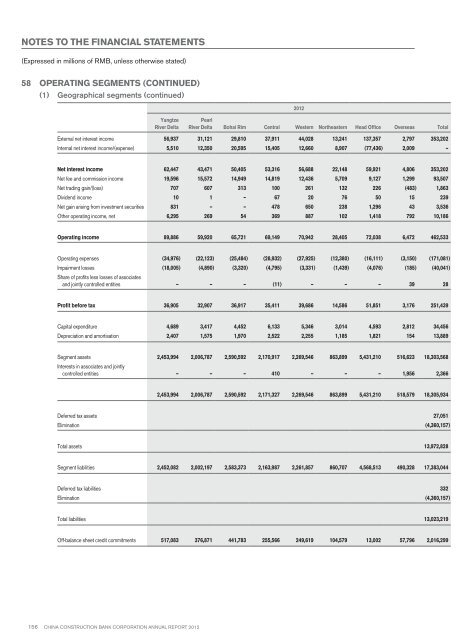
Notes to the financial statements(Expressed in millions of RMB, unless otherwise stated)58 Operating segments (continued)(1) Geographical segments (continued)<strong>2012</strong>YangtzeRiver DeltaPearlRiver Delta Bohai Rim Central Western Northeastern Head Office Overseas TotalExternal net interest income 56,937 31,121 29,810 37,911 44,028 13,241 137,357 2,797 353,202Internal net interest income/(expense) 5,510 12,350 20,595 15,405 12,660 8,907 (77,436) 2,009 –Net interest income 62,447 43,471 50,405 53,316 56,688 22,148 59,921 4,806 353,202Net fee and commission income 19,596 15,572 14,949 14,819 12,436 5,709 9,127 1,299 93,507Net trading gain/(loss) 707 607 313 100 261 132 226 (483) 1,863Dividend income 10 1 – 67 20 76 50 15 239Net gain arising from investment securities 831 – – 478 650 238 1,296 43 3,536Other operating income, net 6,295 269 54 369 887 102 1,418 792 10,186Operating income 89,886 59,920 65,721 69,149 70,942 28,405 72,038 6,472 462,533Operating expenses (34,976) (22,123) (25,484) (28,932) (27,925) (12,380) (16,111) (3,150) (171,081)Impairment losses (18,005) (4,890) (3,320) (4,795) (3,331) (1,439) (4,076) (185) (40,041)Share of profits less losses of associatesand jointly controlled entities – – – (11) – – – 39 28Profit before tax 36,905 32,907 36,917 35,411 39,686 14,586 51,851 3,176 251,439Capital expenditure 4,689 3,417 4,452 6,133 5,346 3,014 4,593 2,812 34,456Depreciation and amortisation 2,407 1,575 1,970 2,522 2,255 1,185 1,821 154 13,889Segment assets 2,453,994 2,006,787 2,590,592 2,170,917 2,269,546 863,899 5,431,210 516,623 18,303,568Interests in associates and jointlycontrolled entities – – – 410 – – – 1,956 2,3662,453,994 2,006,787 2,590,592 2,171,327 2,269,546 863,899 5,431,210 518,579 18,305,934Deferred tax assets 27,051Elimination (4,360,157)Total assets 13,972,828Segment liabilities 2,452,082 2,002,197 2,583,373 2,163,987 2,261,857 860,707 4,568,513 490,328 17,383,044Deferred tax liabilities 332Elimination (4,360,157)Total liabilities 13,023,219Off-balance sheet credit commitments 517,083 376,871 441,783 255,566 249,619 104,579 13,002 57,796 2,016,299156 China Construction Bank Corporation annual report <strong>2012</strong>