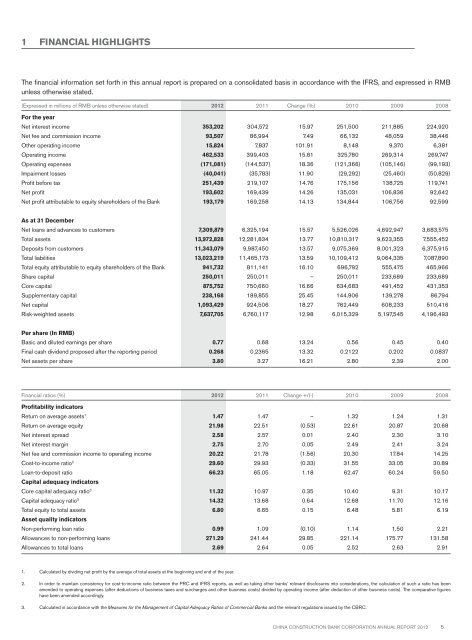
1 FINANCIAL HIGHLIGHTSThe financial information set forth in this annual report is prepared on a consolidated basis in accordance with the IFRS, and expressed in RMBunless otherwise stated.(Expressed in millions of RMB unless otherwise stated) <strong>2012</strong> 2011 Change (%) 2010 2009 2008For the yearNet interest income 353,202 304,572 15.97 251,500 211,885 224,920Net fee and commission income 93,507 86,994 7.49 66,132 48,059 38,446Other operating income 15,824 7,837 101.91 8,148 9,370 6,381Operating income 462,533 399,403 15.81 325,780 269,314 269,747Operating expenses (171,081) (144,537) 18.36 (121,366) (105,146) (99,193)Impairment losses (40,041) (35,783) 11.90 (29,292) (25,460) (50,829)Profit before tax 251,439 219,107 14.76 175,156 138,725 119,741Net profit 193,602 169,439 14.26 135,031 106,836 92,642Net profit attributable to equity shareholders of the Bank 193,179 169,258 14.13 134,844 106,756 92,599As at 31 DecemberNet loans and advances to customers 7,309,879 6,325,194 15.57 5,526,026 4,692,947 3,683,575Total assets 13,972,828 12,281,834 13.77 10,810,317 9,623,355 7,555,452Deposits from customers 11,343,079 9,987,450 13.57 9,075,369 8,001,323 6,375,915Total liabilities 13,023,219 11,465,173 13.59 10,109,412 9,064,335 7,087,890Total equity attributable to equity shareholders of the Bank 941,732 811,141 16.10 696,792 555,475 465,966Share capital 250,011 250,011 – 250,011 233,689 233,689Core capital 875,752 750,660 16.66 634,683 491,452 431,353Supplementary capital 238,168 189,855 25.45 144,906 139,278 86,794Net capital 1,093,429 924,506 18.27 762,449 608,233 510,416Risk-weighted assets 7,637,705 6,760,117 12.98 6,015,329 5,197,545 4,196,493Per share (In RMB)Basic and diluted earnings per share 0.77 0.68 13.24 0.56 0.45 0.40Final cash dividend proposed after the reporting period 0.268 0.2365 13.32 0.2122 0.202 0.0837Net assets per share 3.80 3.27 16.21 2.80 2.39 2.00Financial ratios (%) <strong>2012</strong> 2011 Change +/(-) 2010 2009 2008Profitability indicatorsReturn on average assets 1 1.47 1.47 – 1.32 1.24 1.31Return on average equity 21.98 22.51 (0.53) 22.61 20.87 20.68Net interest spread 2.58 2.57 0.01 2.40 2.30 3.10Net interest margin 2.75 2.70 0.05 2.49 2.41 3.24Net fee and commission income to operating income 20.22 21.78 (1.56) 20.30 17.84 14.25Cost-to-income ratio 2 29.60 29.93 (0.33) 31.55 33.05 30.89Loan-to-deposit ratio 66.23 65.05 1.18 62.47 60.24 59.50Capital adequacy indicatorsCore capital adequacy ratio 3 11.32 10.97 0.35 10.40 9.31 10.17Capital adequacy ratio 3 14.32 13.68 0.64 12.68 11.70 12.16Total equity to total assets 6.80 6.65 0.15 6.48 5.81 6.19Asset quality indicatorsNon-performing loan ratio 0.99 1.09 (0.10) 1.14 1.50 2.21Allowances to non-performing loans 271.29 241.44 29.85 221.14 175.77 131.58Allowances to total loans 2.69 2.64 0.05 2.52 2.63 2.911. Calculated by dividing net profit by the average of total assets at the beginning and end of the year.2. In order to maintain consistency for cost-to-income ratio between the PRC and IFRS reports, as well as taking other banks’ relevant disclosures into considerations, the calculation of such a ratio has beenamended to operating expenses (after deductions of business taxes and surcharges and other business costs) divided by operating income (after deduction of other business costs). The comparative figureshave been amended accordingly.3. Calculated in accordance with the Measures for the Management of Capital Adequacy Ratios of Commercial Banks and the relevant regulations issued by the CBRC.China Construction Bank Corporation annual report <strong>2012</strong>5
2 CORPORATE INFORMATIONLegal name and abbreviation in ChineseLegal name and abbreviation in EnglishLegal representativeAuthorised representativesSecretary to the BoardRepresentative of securities affairsCompany secretaryQualified accountant (abbreviated as “”)China Construction Bank Corporation (abbreviated as “CCB”)Wang HongzhangZhang JianguoCheng Pui Ling, CathyChen CaihongXu ManxiaCheng Pui Ling, CathyYuen Yiu LeungRegistered address, office address and postcode No. 25, Financial Street, Xicheng District, Beijing 100033Internet websiteEmail addressPrincipal place of business in Hong KongNewspapers for information disclosureWebsite of the Shanghai Stock Exchange for publishingthe annual report prepared in accordance with PRC GAAPWebsite of Hong Kong Stock Exchange for publishingthe annual report prepared in accordance with IFRSPlace where copies of this annual report are keptContact InformationListing stock exchanges, stock abbreviations and stock codeswww.ccb.comir@ccb.com12/F, AIA Central, 1 Connaught Road Central, Central, Hong KongChina Securities Journal and Shanghai Securities Newswww.sse.com.cnwww.hkex.com.hkBoard of Directors Office of the BankAddress: No. 25, Financial Street, Xicheng District, BeijingTelephone: 86-10-66215533Facsimile: 86-10-66218888A-share: Shanghai Stock ExchangeStock abbreviation: Stock code: 601939H-share: The Stock Exchange of Hong Kong LimitedStock abbreviation: CCBStock code: 9396 China Construction Bank Corporation annual report <strong>2012</strong>
- Page 1 and 2: Annual Report 2012China Constructio
- Page 3 and 4: DEFINITIONSIn this annual report, u
- Page 5: INTRODUCTIONHeadquartered in Beijin
- Page 9 and 10: 2 CORPORATE INFORMATIONForbes Ranke
- Page 11 and 12: 3 CHAIRMAN’S STATEMENTDear shareh
- Page 13 and 14: 4 PRESIDENT’S REPORTDear sharehol
- Page 15 and 16: 5 MANAGEMENT DISCUSSION AND ANALYSI
- Page 17 and 18: 5 MANAGEMENT DISCUSSION AND ANALYSI
- Page 19 and 20: 5 MANAGEMENT DISCUSSION AND ANALYSI
- Page 21 and 22: 5 MANAGEMENT DISCUSSION AND ANALYSI
- Page 23 and 24: 5 MANAGEMENT DISCUSSION AND ANALYSI
- Page 25 and 26: 5 MANAGEMENT DISCUSSION AND ANALYSI
- Page 27 and 28: 5 MANAGEMENT DISCUSSION AND ANALYSI
- Page 29 and 30: 5 MANAGEMENT DISCUSSION AND ANALYSI
- Page 31 and 32: 5 MANAGEMENT DISCUSSION AND ANALYSI
- Page 33 and 34: 5 MANAGEMENT DISCUSSION AND ANALYSI
- Page 35 and 36: 5 MANAGEMENT DISCUSSION AND ANALYSI
- Page 37 and 38: 5 MANAGEMENT DISCUSSION AND ANALYSI
- Page 39 and 40: 5 MANAGEMENT DISCUSSION AND ANALYSI
- Page 41 and 42: 5 MANAGEMENT DISCUSSION AND ANALYSI
- Page 43 and 44: 5 MANAGEMENT DISCUSSION AND ANALYSI
- Page 45 and 46: 5 MANAGEMENT DISCUSSION AND ANALYSI
- Page 47 and 48: 5 MANAGEMENT DISCUSSION AND ANALYSI
- Page 49 and 50: 5 MANAGEMENT DISCUSSION AND ANALYSI
- Page 51 and 52: 5 MANAGEMENT DISCUSSION AND ANALYSI
- Page 53 and 54: 6 CHANGES IN SHARE CAPITAL AND PART
- Page 55 and 56: 6 CHANGES IN SHARE CAPITAL AND PART
- Page 57 and 58:
7 CORPORATE GOVERNANCE REPORT7.2 BO
- Page 59 and 60:
7 CORPORATE GOVERNANCE REPORTBoard
- Page 61 and 62:
7 CORPORATE GOVERNANCE REPORTImpact
- Page 63 and 64:
7 CORPORATE GOVERNANCE REPORTAudit
- Page 65 and 66:
7 CORPORATE GOVERNANCE REPORTNomina
- Page 67 and 68:
7 CORPORATE GOVERNANCE REPORTCompos
- Page 69 and 70:
7 CORPORATE GOVERNANCE REPORTIn 201
- Page 71 and 72:
7 CORPORATE GOVERNANCE REPORTEffect
- Page 73 and 74:
8 PROFILES OF DIRECTORS, SUPERVISOR
- Page 75 and 76:
8 PROFILES OF DIRECTORS, SUPERVISOR
- Page 77 and 78:
8 PROFILES OF DIRECTORS, SUPERVISOR
- Page 79 and 80:
8 PROFILES OF DIRECTORS, SUPERVISOR
- Page 81 and 82:
8 PROFILES OF DIRECTORS, SUPERVISOR
- Page 83 and 84:
9 REPORT OF THE BOARD OF DIRECTORSP
- Page 85 and 86:
9 REPORT OF THE BOARD OF DIRECTORSD
- Page 87 and 88:
10 REPORT OF THE BOARD OF SUPERVISO
- Page 89 and 90:
11 MAJOR ISSUESMaterial litigations
- Page 91 and 92:
11 MAJOR ISSUESInterests in non-lis
- Page 93 and 94:
Consolidated statement of comprehen
- Page 95 and 96:
Statement of financial positionAs a
- Page 97 and 98:
Statement of changes in equityFor t
- Page 99 and 100:
Consolidated statement of cash flow
- Page 101 and 102:
Notes to the financial statements(E
- Page 103 and 104:
Notes to the financial statements(E
- Page 105 and 106:
Notes to the financial statements(E
- Page 107 and 108:
Notes to the financial statements(E
- Page 109 and 110:
Notes to the financial statements(E
- Page 111 and 112:
Notes to the financial statements(E
- Page 113 and 114:
Notes to the financial statements(E
- Page 115 and 116:
Notes to the financial statements(E
- Page 117 and 118:
Notes to the financial statements(E
- Page 119 and 120:
Notes to the financial statements(E
- Page 121 and 122:
Notes to the financial statements(E
- Page 123 and 124:
Notes to the financial statements(E
- Page 125 and 126:
Notes to the financial statements(E
- Page 127 and 128:
Notes to the financial statements(E
- Page 129 and 130:
Notes to the financial statements(E
- Page 131 and 132:
Notes to the financial statements(E
- Page 133 and 134:
Notes to the financial statements(E
- Page 135 and 136:
Notes to the financial statements(E
- Page 137 and 138:
Notes to the financial statements(E
- Page 139 and 140:
Notes to the financial statements(E
- Page 141 and 142:
Notes to the financial statements(E
- Page 143 and 144:
Notes to the financial statements(E
- Page 145 and 146:
Notes to the financial statements(E
- Page 147 and 148:
Notes to the financial statements(E
- Page 149 and 150:
Notes to the financial statements(E
- Page 151 and 152:
Notes to the financial statements(E
- Page 153 and 154:
Notes to the financial statements(E
- Page 155 and 156:
Notes to the financial statements(E
- Page 157 and 158:
Notes to the financial statements(E
- Page 159 and 160:
Notes to the financial statements(E
- Page 161 and 162:
Notes to the financial statements(E
- Page 163 and 164:
Notes to the financial statements(E
- Page 165 and 166:
Notes to the financial statements(E
- Page 167 and 168:
Notes to the financial statements(E
- Page 169 and 170:
Notes to the financial statements(E
- Page 171 and 172:
Notes to the financial statements(E
- Page 173 and 174:
Notes to the financial statements(E
- Page 175 and 176:
Notes to the financial statements(E
- Page 177 and 178:
Notes to the financial statements(E
- Page 179 and 180:
Notes to the financial statements(E
- Page 181 and 182:
Notes to the financial statements(E
- Page 183 and 184:
Notes to the financial statements(E
- Page 185 and 186:
Notes to the financial statements(E
- Page 187 and 188:
Notes to the financial statements(E
- Page 189 and 190:
Notes to the financial statements(E
- Page 191 and 192:
Notes to the financial statements(E
- Page 193 and 194:
Notes to the financial statements(E
- Page 195 and 196:
Notes to the financial statements(E
- Page 197 and 198:
Notes to the financial statements(E
- Page 199 and 200:
Notes to the financial statements(E
- Page 201 and 202:
Notes to the financial statements(E
- Page 203 and 204:
Notes to the financial statements(E
- Page 205 and 206:
Notes to the financial statements(E
- Page 207 and 208:
Notes to the financial statements(E
- Page 209 and 210:
Notes to the financial statements(E
- Page 211 and 212:
14 UNAUDITED SUPPLEMENTARY FINANCIA
- Page 213 and 214:
15 ORGANISATIONAL STRUCTUREPublic R
- Page 215 and 216:
16 BRANCHES AND SUBSIDIARIESTier-on
- Page 217 and 218:
16 BRANCHES AND SUBSIDIARIESBranche
- Page 219 and 220:
16 BRANCHES AND SUBSIDIARIESChongqi
- Page 221:
16 BRANCHES AND SUBSIDIARIESZhejian