Annual Report 2012
Annual Report 2012
Annual Report 2012
- No tags were found...
You also want an ePaper? Increase the reach of your titles
YUMPU automatically turns print PDFs into web optimized ePapers that Google loves.
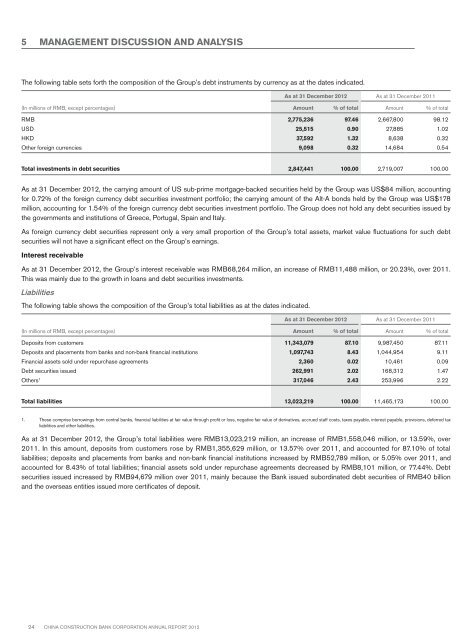
5 MANAGEMENT DISCUSSION AND ANALYSISThe following table sets forth the composition of the Group’s debt instruments by currency as at the dates indicated.As at 31 December <strong>2012</strong> As at 31 December 2011(In millions of RMB, except percentages) Amount % of total Amount % of totalRMB 2,775,236 97.46 2,667,800 98.12USD 25,515 0.90 27,885 1.02HKD 37,592 1.32 8,638 0.32Other foreign currencies 9,098 0.32 14,684 0.54Total investments in debt securities 2,847,441 100.00 2,719,007 100.00As at 31 December <strong>2012</strong>, the carrying amount of US sub-prime mortgage-backed securities held by the Group was US$84 million, accountingfor 0.72% of the foreign currency debt securities investment portfolio; the carrying amount of the Alt-A bonds held by the Group was US$178million, accounting for 1.54% of the foreign currency debt securities investment portfolio. The Group does not hold any debt securities issued bythe governments and institutions of Greece, Portugal, Spain and Italy.As foreign currency debt securities represent only a very small proportion of the Group’s total assets, market value fluctuations for such debtsecurities will not have a significant effect on the Group’s earnings.Interest receivableAs at 31 December <strong>2012</strong>, the Group’s interest receivable was RMB68,264 million, an increase of RMB11,488 million, or 20.23%, over 2011.This was mainly due to the growth in loans and debt securities investments.LiabilitiesThe following table shows the composition of the Group’s total liabilities as at the dates indicated.As at 31 December <strong>2012</strong> As at 31 December 2011(In millions of RMB, except percentages) Amount % of total Amount % of totalDeposits from customers 11,343,079 87.10 9,987,450 87.11Deposits and placements from banks and non-bank financial institutions 1,097,743 8.43 1,044,954 9.11Financial assets sold under repurchase agreements 2,360 0.02 10,461 0.09Debt securities issued 262,991 2.02 168,312 1.47Others 1 317,046 2.43 253,996 2.22Total liabilities 13,023,219 100.00 11,465,173 100.001. These comprise borrowings from central banks, financial liabilities at fair value through profit or loss, negative fair value of derivatives, accrued staff costs, taxes payable, interest payable, provisions, deferred taxliabilities and other liabilities.As at 31 December <strong>2012</strong>, the Group’s total liabilities were RMB13,023,219 million, an increase of RMB1,558,046 million, or 13.59%, over2011. In this amount, deposits from customers rose by RMB1,355,629 million, or 13.57% over 2011, and accounted for 87.10% of totalliabilities; deposits and placements from banks and non-bank financial institutions increased by RMB52,789 million, or 5.05% over 2011, andaccounted for 8.43% of total liabilities; financial assets sold under repurchase agreements decreased by RMB8,101 million, or 77.44%. Debtsecurities issued increased by RMB94,679 million over 2011, mainly because the Bank issued subordinated debt securities of RMB40 billionand the overseas entities issued more certificates of deposit.24 China Construction Bank Corporation annual report <strong>2012</strong>


