- Page 1 and 2:
Annual Report 2012China Constructio
- Page 3 and 4:
DEFINITIONSIn this annual report, u
- Page 5 and 6:
INTRODUCTIONHeadquartered in Beijin
- Page 7 and 8:
2 CORPORATE INFORMATIONLegal name a
- Page 9 and 10:
2 CORPORATE INFORMATIONForbes Ranke
- Page 11 and 12:
3 CHAIRMAN’S STATEMENTDear shareh
- Page 13 and 14:
4 PRESIDENT’S REPORTDear sharehol
- Page 15 and 16:
5 MANAGEMENT DISCUSSION AND ANALYSI
- Page 17 and 18:
5 MANAGEMENT DISCUSSION AND ANALYSI
- Page 19 and 20:
5 MANAGEMENT DISCUSSION AND ANALYSI
- Page 21 and 22:
5 MANAGEMENT DISCUSSION AND ANALYSI
- Page 23 and 24:
5 MANAGEMENT DISCUSSION AND ANALYSI
- Page 25 and 26:
5 MANAGEMENT DISCUSSION AND ANALYSI
- Page 27 and 28:
5 MANAGEMENT DISCUSSION AND ANALYSI
- Page 29 and 30:
5 MANAGEMENT DISCUSSION AND ANALYSI
- Page 31 and 32:
5 MANAGEMENT DISCUSSION AND ANALYSI
- Page 33 and 34:
5 MANAGEMENT DISCUSSION AND ANALYSI
- Page 35 and 36:
5 MANAGEMENT DISCUSSION AND ANALYSI
- Page 37 and 38:
5 MANAGEMENT DISCUSSION AND ANALYSI
- Page 39 and 40:
5 MANAGEMENT DISCUSSION AND ANALYSI
- Page 41 and 42:
5 MANAGEMENT DISCUSSION AND ANALYSI
- Page 43 and 44:
5 MANAGEMENT DISCUSSION AND ANALYSI
- Page 45 and 46:
5 MANAGEMENT DISCUSSION AND ANALYSI
- Page 47 and 48:
5 MANAGEMENT DISCUSSION AND ANALYSI
- Page 49 and 50:
5 MANAGEMENT DISCUSSION AND ANALYSI
- Page 51 and 52:
5 MANAGEMENT DISCUSSION AND ANALYSI
- Page 53 and 54:
6 CHANGES IN SHARE CAPITAL AND PART
- Page 55 and 56:
6 CHANGES IN SHARE CAPITAL AND PART
- Page 57 and 58:
7 CORPORATE GOVERNANCE REPORT7.2 BO
- Page 59 and 60:
7 CORPORATE GOVERNANCE REPORTBoard
- Page 61 and 62:
7 CORPORATE GOVERNANCE REPORTImpact
- Page 63 and 64:
7 CORPORATE GOVERNANCE REPORTAudit
- Page 65 and 66:
7 CORPORATE GOVERNANCE REPORTNomina
- Page 67 and 68:
7 CORPORATE GOVERNANCE REPORTCompos
- Page 69 and 70:
7 CORPORATE GOVERNANCE REPORTIn 201
- Page 71 and 72:
7 CORPORATE GOVERNANCE REPORTEffect
- Page 73 and 74:
8 PROFILES OF DIRECTORS, SUPERVISOR
- Page 75 and 76:
8 PROFILES OF DIRECTORS, SUPERVISOR
- Page 77 and 78:
8 PROFILES OF DIRECTORS, SUPERVISOR
- Page 79 and 80:
8 PROFILES OF DIRECTORS, SUPERVISOR
- Page 81 and 82:
8 PROFILES OF DIRECTORS, SUPERVISOR
- Page 83 and 84:
9 REPORT OF THE BOARD OF DIRECTORSP
- Page 85 and 86:
9 REPORT OF THE BOARD OF DIRECTORSD
- Page 87 and 88:
10 REPORT OF THE BOARD OF SUPERVISO
- Page 89 and 90:
11 MAJOR ISSUESMaterial litigations
- Page 91 and 92:
11 MAJOR ISSUESInterests in non-lis
- Page 93 and 94:
Consolidated statement of comprehen
- Page 95 and 96:
Statement of financial positionAs a
- Page 97 and 98:
Statement of changes in equityFor t
- Page 99 and 100:
Consolidated statement of cash flow
- Page 101 and 102:
Notes to the financial statements(E
- Page 103 and 104:
Notes to the financial statements(E
- Page 105 and 106:
Notes to the financial statements(E
- Page 107 and 108:
Notes to the financial statements(E
- Page 109 and 110:
Notes to the financial statements(E
- Page 111 and 112:
Notes to the financial statements(E
- Page 113 and 114: Notes to the financial statements(E
- Page 115 and 116: Notes to the financial statements(E
- Page 117 and 118: Notes to the financial statements(E
- Page 119 and 120: Notes to the financial statements(E
- Page 121 and 122: Notes to the financial statements(E
- Page 123 and 124: Notes to the financial statements(E
- Page 125 and 126: Notes to the financial statements(E
- Page 127 and 128: Notes to the financial statements(E
- Page 129 and 130: Notes to the financial statements(E
- Page 131 and 132: Notes to the financial statements(E
- Page 133 and 134: Notes to the financial statements(E
- Page 135 and 136: Notes to the financial statements(E
- Page 137 and 138: Notes to the financial statements(E
- Page 139 and 140: Notes to the financial statements(E
- Page 141 and 142: Notes to the financial statements(E
- Page 143 and 144: Notes to the financial statements(E
- Page 145 and 146: Notes to the financial statements(E
- Page 147 and 148: Notes to the financial statements(E
- Page 149 and 150: Notes to the financial statements(E
- Page 151 and 152: Notes to the financial statements(E
- Page 153 and 154: Notes to the financial statements(E
- Page 155 and 156: Notes to the financial statements(E
- Page 157 and 158: Notes to the financial statements(E
- Page 159 and 160: Notes to the financial statements(E
- Page 161 and 162: Notes to the financial statements(E
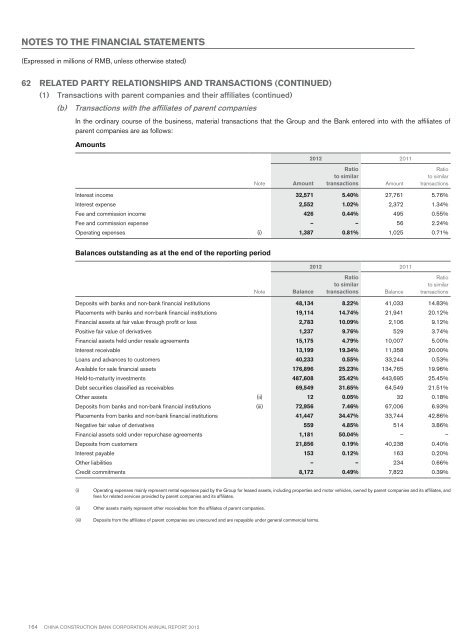
- Page 163: Notes to the financial statements(E
- Page 167 and 168: Notes to the financial statements(E
- Page 169 and 170: Notes to the financial statements(E
- Page 171 and 172: Notes to the financial statements(E
- Page 173 and 174: Notes to the financial statements(E
- Page 175 and 176: Notes to the financial statements(E
- Page 177 and 178: Notes to the financial statements(E
- Page 179 and 180: Notes to the financial statements(E
- Page 181 and 182: Notes to the financial statements(E
- Page 183 and 184: Notes to the financial statements(E
- Page 185 and 186: Notes to the financial statements(E
- Page 187 and 188: Notes to the financial statements(E
- Page 189 and 190: Notes to the financial statements(E
- Page 191 and 192: Notes to the financial statements(E
- Page 193 and 194: Notes to the financial statements(E
- Page 195 and 196: Notes to the financial statements(E
- Page 197 and 198: Notes to the financial statements(E
- Page 199 and 200: Notes to the financial statements(E
- Page 201 and 202: Notes to the financial statements(E
- Page 203 and 204: Notes to the financial statements(E
- Page 205 and 206: Notes to the financial statements(E
- Page 207 and 208: Notes to the financial statements(E
- Page 209 and 210: Notes to the financial statements(E
- Page 211 and 212: 14 UNAUDITED SUPPLEMENTARY FINANCIA
- Page 213 and 214: 15 ORGANISATIONAL STRUCTUREPublic R
- Page 215 and 216:
16 BRANCHES AND SUBSIDIARIESTier-on
- Page 217 and 218:
16 BRANCHES AND SUBSIDIARIESBranche
- Page 219 and 220:
16 BRANCHES AND SUBSIDIARIESChongqi
- Page 221:
16 BRANCHES AND SUBSIDIARIESZhejian