Notes to the financial statements(Expressed in millions of RMB, unless otherwise stated)63 Risk Management (continued)(5) Fair value (continued)(a) Financial assets (continued)GroupCarrying valueFair value<strong>2012</strong> 2011 <strong>2012</strong> 2011Debt securities classified as receivables 219,713 300,027 209,123 291,829Held-to-maturity investments 1,918,322 1,743,569 1,915,573 1,753,842Total 2,138,035 2,043,596 2,124,696 2,045,671BankCarrying valueFair value<strong>2012</strong> 2011 <strong>2012</strong> 2011Debt securities classified as receivables 217,741 299,765 207,166 291,569Held-to-maturity investments 1,915,811 1,742,342 1,913,050 1,752,585Total 2,133,552 2,042,107 2,120,216 2,044,154(b) Financial liabilitiesThe Group’s financial liabilities mainly include borrowings from central banks, deposits and placements from banks andnon-bank financial institutions, financial liabilities at fair value through profit or loss, financial assets sold under repurchaseagreements, deposits from customers, and debt securities issued. The carrying values of financial liabilities approximated theirfair values as at the end of the reporting period, except that the fair value of subordinated bonds issued as at 31 December<strong>2012</strong> was RMB156,262 million (2011: RMB117,969 million), which was lower than their carrying value of RMB159,834million (2011: RMB119,861 million).(6) Valuation of financial instrumentsThe Group measures fair values using the following fair value hierarchy that reflects the significance of the inputs used in making themeasurements:• Level 1: Quoted market price (unadjusted) in an active market for an identical instrument.• Level 2: Valuation techniques based on observable inputs, either directly (i.e., as prices) or indirectly (i.e., derived from prices).This category includes instruments valued using: quoted market prices in active markets for similar instruments; quoted pricesfor identical or similar instruments in markets that are considered less than active; or other valuation techniques where allsignificant inputs are directly or indirectly from market data.• Level 3: Valuation techniques using significant unobservable inputs. This category includes all instruments where thevaluation technique includes inputs not based on observable data and the unobservable inputs have a significant effect on theinstrument’s valuation. This category includes instruments that are valued based on quoted prices for similar instruments wheresignificant unobservable adjustments or assumptions are required to reflect differences between the instruments.China Construction Bank Corporation annual report <strong>2012</strong>201
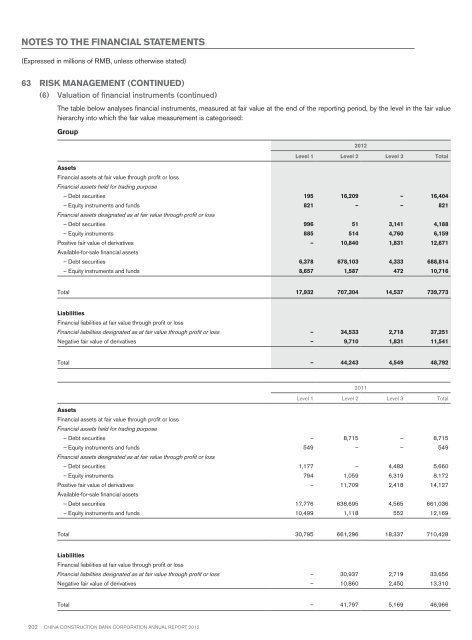
Notes to the financial statements(Expressed in millions of RMB, unless otherwise stated)63 Risk Management (continued)(6) Valuation of financial instruments (continued)The table below analyses financial instruments, measured at fair value at the end of the reporting period, by the level in the fair valuehierarchy into which the fair value measurement is categorised:Group<strong>2012</strong>Level 1 Level 2 Level 3 TotalAssetsFinancial assets at fair value through profit or lossFinancial assets held for trading purpose– Debt securities 195 16,209 – 16,404– Equity instruments and funds 821 – – 821Financial assets designated as at fair value through profit or loss– Debt securities 996 51 3,141 4,188– Equity instruments 885 514 4,760 6,159Positive fair value of derivatives – 10,840 1,831 12,671Available-for-sale financial assets– Debt securities 6,378 678,103 4,333 688,814– Equity instruments and funds 8,657 1,587 472 10,716Total 17,932 707,304 14,537 739,773LiabilitiesFinancial liabilities at fair value through profit or lossFinancial liabilities designated as at fair value through profit or loss – 34,533 2,718 37,251Negative fair value of derivatives – 9,710 1,831 11,541Total – 44,243 4,549 48,7922011Level 1 Level 2 Level 3 TotalAssetsFinancial assets at fair value through profit or lossFinancial assets held for trading purpose– Debt securities – 8,715 – 8,715– Equity instruments and funds 549 – – 549Financial assets designated as at fair value through profit or loss– Debt securities 1,177 – 4,483 5,660– Equity instruments 794 1,059 6,319 8,172Positive fair value of derivatives – 11,709 2,418 14,127Available-for-sale financial assets– Debt securities 17,776 638,695 4,565 661,036– Equity instruments and funds 10,499 1,118 552 12,169Total 30,795 661,296 18,337 710,428LiabilitiesFinancial liabilities at fair value through profit or lossFinancial liabilities designated as at fair value through profit or loss – 30,937 2,719 33,656Negative fair value of derivatives – 10,860 2,450 13,310Total – 41,797 5,169 46,966202 China Construction Bank Corporation annual report <strong>2012</strong>