Notes to the financial statements(Expressed in millions of RMB, unless otherwise stated)63 Risk Management (continued)(2) Market risk (continued)(c) Interest rate repricing gap analysis (continued)Group (continued)2011NoteEffectiveinterestrate (i)NoninterestbearingWithinthreemonthsBetweenthreemonthsandone yearBetweenone yearandfive yearsMore thanFive yearsTotalAssetsCash and deposits with central banks 1.54% 197,288 2,182,521 – – – 2,379,809Deposits and placements with banks andnon-bank financial institutions 2.75% – 279,079 105,486 1,151 76 385,792Financial assets held resale agreements 4.03% – 198,966 1,079 – – 200,045Loans and advances to customers (ii) 5.69% – 3,485,517 2,746,432 26,964 66,281 6,325,194Investments (iii) 3.27% 24,811 258,463 465,984 1,098,204 896,357 2,743,819Other assets – 247,175 – – – – 247,175Total assets 4.27% 469,274 6,404,546 3,318,981 1,126,319 962,714 12,281,834LiabilitiesBorrowings from central banks 0.98% – 2,220 – – – 2,220Deposits and placements from banks andnon-bank financial institutions 2.35% – 948,479 58,520 37,955 – 1,044,954Financial liabilities at fair value throughprofit or loss 1.33% 12,683 11,669 9,304 – – 33,656Financial assets sold under repurchaseagreements 5.67% – 9,543 918 – – 10,461Deposits from customers 1.61% 44,435 7,185,234 2,057,323 692,825 7,633 9,987,450Debt securities issued 3.41% – 18,100 20,518 31,123 98,571 168,312Other liabilities – 218,120 – – – – 218,120Total liabilities 1.70% 275,238 8,175,245 2,146,583 761,903 106,204 11,465,173Asset-liability gap 2.57% 194,036 (1,770,699) 1,172,398 364,416 856,510 816,661Notes:(i)Effective interest rate represents the ratio of interest income/expense to average interest bearing assets/liabilities.(ii) For loans and advances to customers, the “within three months” category includes overdue amounts (net of allowances for impairment losses) of RMB32,017 million as at 31December <strong>2012</strong> (2011: RMB25,121 million).(iii)Investments include financial assets at fair value through profit or loss, available-for-sale financial assets, held-to-maturity investment, debt securities classified as receivables andinvestments in associates and jointly controlled entities.China Construction Bank Corporation annual report <strong>2012</strong>187
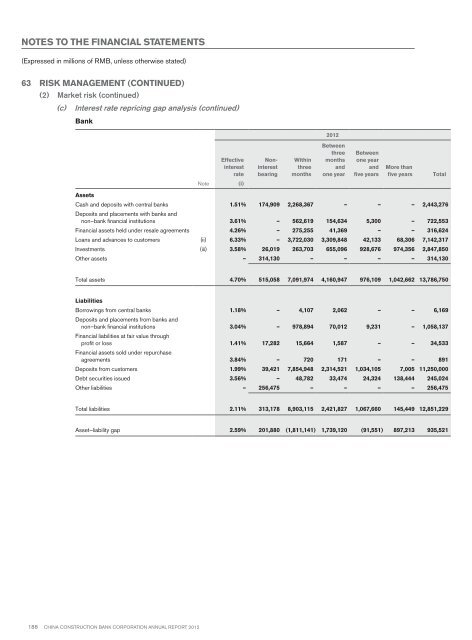
Notes to the financial statements(Expressed in millions of RMB, unless otherwise stated)63 Risk Management (continued)(2) Market risk (continued)(c) Interest rate repricing gap analysis (continued)Bank<strong>2012</strong>EffectiveinterestrateNoninterestbearingWithinthreemonthsBetweenthreemonthsandone yearBetweenone yearandfive yearsMore thanfive yearsTotalNote(i)AssetsCash and deposits with central banks 1.51% 174,909 2,268,367 – – – 2,443,276Deposits and placements with banks andnon–bank financial institutions 3.61% – 562,619 154,634 5,300 – 722,553Financial assets held under resale agreements 4.26% – 275,255 41,369 – – 316,624Loans and advances to customers (ii) 6.33% – 3,722,030 3,309,848 42,133 68,306 7,142,317Investments (iii) 3.58% 26,019 263,703 655,096 928,676 974,356 2,847,850Other assets – 314,130 – – – – 314,130Total assets 4.70% 515,058 7,091,974 4,160,947 976,109 1,042,662 13,786,750LiabilitiesBorrowings from central banks 1.18% – 4,107 2,062 – – 6,169Deposits and placements from banks andnon–bank financial institutions 3.04% – 978,894 70,012 9,231 – 1,058,137Financial liabilities at fair value throughprofit or loss 1.41% 17,282 15,664 1,587 – – 34,533Financial assets sold under repurchaseagreements 3.84% – 720 171 – – 891Deposits from customers 1.99% 39,421 7,854,948 2,314,521 1,034,105 7,005 11,250,000Debt securities issued 3.56% – 48,782 33,474 24,324 138,444 245,024Other liabilities – 256,475 – – – – 256,475Total liabilities 2.11% 313,178 8,903,115 2,421,827 1,067,660 145,449 12,851,229Asset–liability gap 2.59% 201,880 (1,811,141) 1,739,120 (91,551) 897,213 935,521188 China Construction Bank Corporation annual report <strong>2012</strong>