Annual Report 2012
Annual Report 2012
Annual Report 2012
- No tags were found...

You also want an ePaper? Increase the reach of your titles
YUMPU automatically turns print PDFs into web optimized ePapers that Google loves.
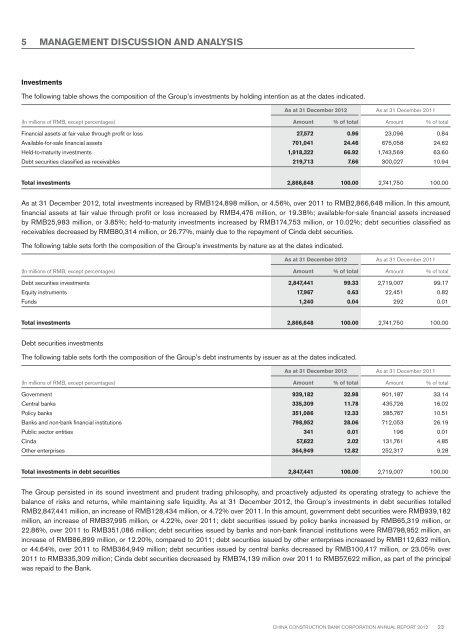
5 MANAGEMENT DISCUSSION AND ANALYSISInvestmentsThe following table shows the composition of the Group’s investments by holding intention as at the dates indicated.As at 31 December <strong>2012</strong> As at 31 December 2011(In millions of RMB, except percentages) Amount % of total Amount % of totalFinancial assets at fair value through profit or loss 27,572 0.96 23,096 0.84Available-for-sale financial assets 701,041 24.46 675,058 24.62Held-to-maturity investments 1,918,322 66.92 1,743,569 63.60Debt securities classified as receivables 219,713 7.66 300,027 10.94Total investments 2,866,648 100.00 2,741,750 100.00As at 31 December <strong>2012</strong>, total investments increased by RMB124,898 million, or 4.56%, over 2011 to RMB2,866,648 million. In this amount,financial assets at fair value through profit or loss increased by RMB4,476 million, or 19.38%; available-for-sale financial assets increasedby RMB25,983 million, or 3.85%; held-to-maturity investments increased by RMB174,753 million, or 10.02%; debt securities classified asreceivables decreased by RMB80,314 million, or 26.77%, mainly due to the repayment of Cinda debt securities.The following table sets forth the composition of the Group’s investments by nature as at the dates indicated.As at 31 December <strong>2012</strong> As at 31 December 2011(In millions of RMB, except percentages) Amount % of total Amount % of totalDebt securities investments 2,847,441 99.33 2,719,007 99.17Equity instruments 17,967 0.63 22,451 0.82Funds 1,240 0.04 292 0.01Total investments 2,866,648 100.00 2,741,750 100.00Debt securities investmentsThe following table sets forth the composition of the Group’s debt instruments by issuer as at the dates indicated.As at 31 December <strong>2012</strong> As at 31 December 2011(In millions of RMB, except percentages) Amount % of total Amount % of totalGovernment 939,182 32.98 901,187 33.14Central banks 335,309 11.78 435,726 16.02Policy banks 351,086 12.33 285,767 10.51Banks and non-bank financial institutions 798,952 28.06 712,053 26.19Public sector entities 341 0.01 196 0.01Cinda 57,622 2.02 131,761 4.85Other enterprises 364,949 12.82 252,317 9.28Total investments in debt securities 2,847,441 100.00 2,719,007 100.00The Group persisted in its sound investment and prudent trading philosophy, and proactively adjusted its operating strategy to achieve thebalance of risks and returns, while maintaining safe liquidity. As at 31 December <strong>2012</strong>, the Group’s investments in debt securities totalledRMB2,847,441 million, an increase of RMB128,434 million, or 4.72% over 2011. In this amount, government debt securities were RMB939,182million, an increase of RMB37,995 million, or 4.22%, over 2011; debt securities issued by policy banks increased by RMB65,319 million, or22.86%, over 2011 to RMB351,086 million; debt securities issued by banks and non-bank financial institutions were RMB798,952 million, anincrease of RMB86,899 million, or 12.20%, compared to 2011; debt securities issued by other enterprises increased by RMB112,632 million,or 44.64%, over 2011 to RMB364,949 million; debt securities issued by central banks decreased by RMB100,417 million, or 23.05% over2011 to RMB335,309 million; Cinda debt securities decreased by RMB74,139 million over 2011 to RMB57,622 million, as part of the principalwas repaid to the Bank.China Construction Bank Corporation annual report <strong>2012</strong>23