Annual Report 2012
Annual Report 2012
Annual Report 2012
- No tags were found...

You also want an ePaper? Increase the reach of your titles
YUMPU automatically turns print PDFs into web optimized ePapers that Google loves.
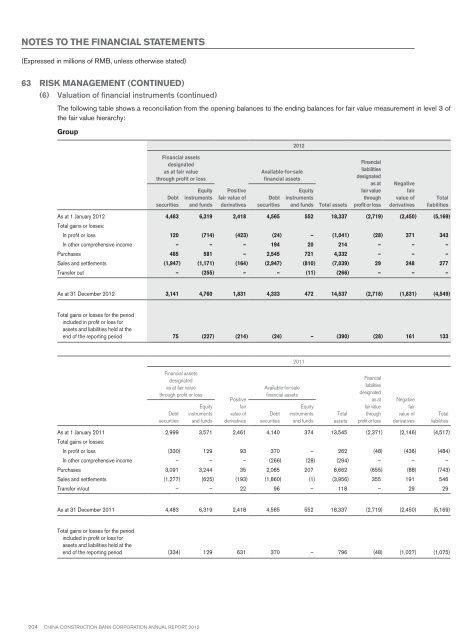
Notes to the financial statements(Expressed in millions of RMB, unless otherwise stated)63 Risk Management (continued)(6) Valuation of financial instruments (continued)The following table shows a reconciliation from the opening balances to the ending balances for fair value measurement in level 3 ofthe fair value hierarchy:Group<strong>2012</strong>Financial assetsdesignatedas at fair valuethrough profit or lossDebtsecuritiesEquityinstrumentsand fundsPositivefair value ofderivativesAvailable-for-salefinancial assetsDebtsecuritiesEquityinstrumentsand fundsTotal assetsFinancialliabilitiesdesignatedas atfair valuethroughprofit or lossNegativefairvalue ofderivativesTotalliabilitiesAs at 1 January <strong>2012</strong> 4,483 6,319 2,418 4,565 552 18,337 (2,719) (2,450) (5,169)Total gains or losses:In profit or loss 120 (714) (423) (24) – (1,041) (28) 371 343In other comprehensive income – – – 194 20 214 – – –Purchases 485 581 – 2,545 721 4,332 – – –Sales and settlements (1,947) (1,171) (164) (2,947) (810) (7,039) 29 248 277Transfer out – (255) – – (11) (266) – – –As at 31 December <strong>2012</strong> 3,141 4,760 1,831 4,333 472 14,537 (2,718) (1,831) (4,549)Total gains or losses for the periodincluded in profit or loss forassets and liabilities held at theend of the reporting period 75 (227) (214) (24) – (390) (28) 161 1332011Financial assetsdesignatedas at fair valuethrough profit or lossDebtsecuritiesEquityinstrumentsand fundsPositivefairvalue ofderivativesAvailable-for-salefinancial assetsDebtsecuritiesEquityinstrumentsand fundsTotalassetsFinancialliabilitiesdesignatedas atfair valuethroughprofit or lossNegativefairvalue ofderivativesTotalliabilitiesAs at 1 January 2011 2,999 3,571 2,461 4,140 374 13,545 (2,371) (2,146) (4,517)Total gains or losses:In profit or loss (330) 129 93 370 – 262 (48) (436) (484)In other comprehensive income – – – (266) (28) (294) – – –Purchases 3,091 3,244 35 2,085 207 8,662 (655) (88) (743)Sales and settlements (1,277) (625) (193) (1,860) (1) (3,956) 355 191 546Transfer in/out – – 22 96 – 118 – 29 29As at 31 December 2011 4,483 6,319 2,418 4,565 552 18,337 (2,719) (2,450) (5,169)Total gains or losses for the periodincluded in profit or loss forassets and liabilities held at theend of the reporting period (334) 129 631 370 – 796 (48) (1,027) (1,075)204 China Construction Bank Corporation annual report <strong>2012</strong>