5 MANAGEMENT DISCUSSION AND ANALYSISLeverage RatioAs at 31 December <strong>2012</strong>, the Group’s leverage ratio was 5.41%, above the regulatory requirement of the CBRC.(In millions of RMB, except percentages)As at31 December <strong>2012</strong>Leverage Ratio 1 5.41%Core capital 875,752Deductions from core capital (10,974)Net Core Capital 864,778On-balance sheet assets after adjustment 2 13,984,994Off-balance sheet items after adjustment 3 2,016,299On and off-balance sheet assets after adjustment 4 15,990,3191. Leverage ratio is calculated in accordance with relevant regulatory requirements. The net core capital is consistent with that used in the calculation of capital adequacy ratio by the Group.2. On-balance sheet assets after adjustment include derivatives using the current risk exposure approach and other on-balance sheet assets calculated.3. Off-balance sheet items after adjustment include unconditionally cancellable commitments with a conversion factor of 10% and other off-balance sheet items.4. On and off-balance sheet assets after adjustment = On-balance sheet assets after adjustment + Off-balance sheet items after adjustment – Deductions from core capitalAnalysis of Off-Balance Sheet ItemsThe Group’s off-balance sheet items include derivatives, commitments and contingent liabilities. Derivatives include interest rate contracts,exchange rate contracts, precious metal contracts, and equity instrument contracts. Please refer to Note “Derivatives” in the “FinancialStatements” of this annual report for details on the nominal amounts and fair value of derivatives. Commitments and contingent liabilities includecredit commitments, operating lease commitments, capital commitments, underwriting obligations, redemption obligations, outstanding litigationand disputes. Among these, credit commitments were the largest component, with an amount of RMB2,016,299 million as at 31 December<strong>2012</strong>, an increase of RMB34,350 million over 2011. Its credit risk-weighted amount was RMB908,026 million, a decrease of RMB21,655million from the previous year, largely because the Group strengthened off-balance sheet business management by imposing reasonable controlson the growth of off-balance sheet assets and clearing ineffective risk assets. Please refer to Note “Commitments and contingent liabilities” in the“Financial Statements” of this annual report for details on commitments and contingent liabilities.5.1.3 Loan Quality AnalysisDistribution of Loans by the Five-Category ClassificationThe following table sets forth, as at the dates indicated, the distribution of the Group’s loans by the five-category loan classification under whichNPLs include substandard, doubtful and loss categories.As at 31 December <strong>2012</strong> As at 31 December 2011(In millions of RMB, except percentages) Amount % of total Amount % of totalNormal 7,233,287 96.29 6,227,770 95.87Special mention 204,407 2.72 197,726 3.04Substandard 32,745 0.43 38,974 0.60Doubtful 33,713 0.45 23,075 0.35Loss 8,160 0.11 8,866 0.14Gross loans and advances to customers 7,512,312 100.00 6,496,411 100.00Non-performing loans 74,618 70,915Non-performing loan ratio 0.99 1.09In <strong>2012</strong>, the Group stepped up credit structure adjustments, strengthened comprehensive post-lending management and risk prevention andmitigation, and expedited NPL disposal. As a result, credit asset quality continued to be stable. As at 31 December <strong>2012</strong>, the Group’s NPLswere RMB74,618 million, an increase of RMB3,703 million from 2011, while the NPL ratio dropped by 0.10 percentage points to 0.99%. Theproportion of special mention loans slid to 2.72%, 0.32 percentage points lower from 2011.China Construction Bank Corporation annual report <strong>2012</strong>27
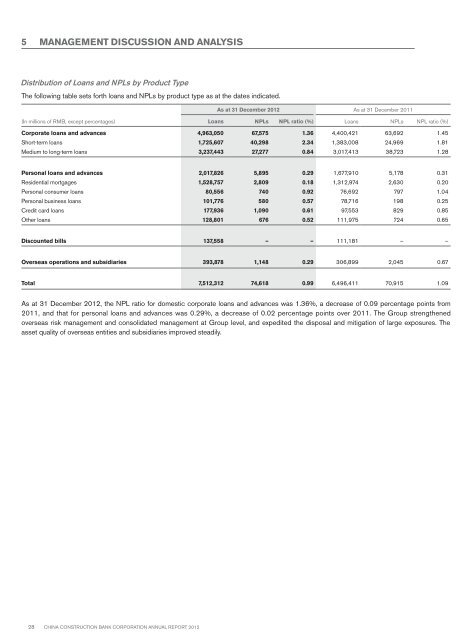
5 MANAGEMENT DISCUSSION AND ANALYSISDistribution of Loans and NPLs by Product TypeThe following table sets forth loans and NPLs by product type as at the dates indicated.As at 31 December <strong>2012</strong> As at 31 December 2011(In millions of RMB, except percentages) Loans NPLs NPL ratio (%) Loans NPLs NPL ratio (%)Corporate loans and advances 4,963,050 67,575 1.36 4,400,421 63,692 1.45Short-term loans 1,725,607 40,298 2.34 1,383,008 24,969 1.81Medium to long-term loans 3,237,443 27,277 0.84 3,017,413 38,723 1.28Personal loans and advances 2,017,826 5,895 0.29 1,677,910 5,178 0.31Residential mortgages 1,528,757 2,809 0.18 1,312,974 2,630 0.20Personal consumer loans 80,556 740 0.92 76,692 797 1.04Personal business loans 101,776 580 0.57 78,716 198 0.25Credit card loans 177,936 1,090 0.61 97,553 829 0.85Other loans 128,801 676 0.52 111,975 724 0.65Discounted bills 137,558 – – 111,181 – –Overseas operations and subsidiaries 393,878 1,148 0.29 306,899 2,045 0.67Total 7,512,312 74,618 0.99 6,496,411 70,915 1.09As at 31 December <strong>2012</strong>, the NPL ratio for domestic corporate loans and advances was 1.36%, a decrease of 0.09 percentage points from2011, and that for personal loans and advances was 0.29%, a decrease of 0.02 percentage points over 2011. The Group strengthenedoverseas risk management and consolidated management at Group level, and expedited the disposal and mitigation of large exposures. Theasset quality of overseas entities and subsidiaries improved steadily.28 China Construction Bank Corporation annual report <strong>2012</strong>