5 MANAGEMENT DISCUSSION AND ANALYSISConcentration of credit risksIn line with regulatory requirements, the Group proactively adopted a series of measures to prevent large exposure concentration risk, includingfurther tightening lending criteria, adjusting business structure, controlling the credit granting pace, revitalising existing credit assets andinnovating products. At the end of <strong>2012</strong>, the gross loans to the largest single borrower accounted for 3.86% of the net capital of the Group,while those to the ten largest customers accounted for 14.76% of the net capital.Concentration of loansConcentration indicatorAs at31 December <strong>2012</strong>As at31 December 2011As at31 December 2010Ratio of loans to the largest single customer (%) 3.86 3.30 2.76Ratio of loans to the ten largest customers (%) 14.76 15.18 16.00The Group’s ten largest single borrowers as at the date indicated are as follows:As at 31 December <strong>2012</strong>(In millions of RMB, except percentages) Industry Amount % of total loansCustomer A Transportation, storage and postal services 42,160 0.56Customer B Transportation, storage and postal services 17,009 0.23Customer C Manufacturing 16,739 0.22Customer D Transportation, storage and postal services 13,973 0.19Customer E Production and supply of electric power, heat, gas and water 12,185 0.16Customer F Transportation, storage and postal services 12,116 0.16Customer G Transportation, storage and postal services 11,981 0.16Customer H Transportation, storage and postal services 11,880 0.16Customer I Water, environment and public utility management 11,680 0.16Customer J Transportation, storage and postal services 11,640 0.15Total 161,363 2.155.3.3 Liquidity Risk ManagementLiquidity risk is the type of risk that occurs when, despite its debt servicing ability, the Bank cannot obtain sufficient funds in time, or at areasonable cost, to meet the needs of asset growth or repay liabilities as they are due. The Bank’s objective for liquidity risk management is tomaintain a reasonable level of liquidity, and ensure the payment and settlement security in compliance with the regulatory requirements, whilestriving to enhance fund yields by deploying its funds in an effective and reasonable way.In <strong>2012</strong>, the PBC lowered the statutory deposit reserve ratio twice by a total of one percentage point, and continuously injected liquidity into themarket through reverse repurchase transactions, gradually easing the tight liquidity situation in the interbank market. However, as the statutorydeposit reserve ratio was still at a high level, the banks’ function of creating derivative deposits was inhibited to some extent, leading to increasedcompetition for deposits business. In response to its liquidity situation, the Bank took timely measures, including actively attracting deposits,adjusting the amounts of investments in debt securities, financial assets held under resale agreements, deposits with banks and non-bankfinancial institutions, and other products that have large influence on liquidity, and making flexible adjustments in accordance with its liquidityposition. Through these effective measures, the Bank continued to maintain a reasonable level of liquidity, and ensured normal payment andsettlement. The Bank conducted regular stress tests on its liquidity risk, in order to gauge its risk tolerance in extreme scenarios of low probabilityand other adverse circumstances. The results showed that under the stress scenarios, although liquidity risk increased, it stayed within acontrollable range.The following table sets forth the liquidity ratios of RMB and foreign currency of the Group:(%)RegulatorystandardAs at31 December <strong>2012</strong>As at31 December 2011As at31 December 2010Liquidity ratio RMB ≥25 56.73 53.70 51.96Foreign currency ≥25 58.81 53.54 57.20China Construction Bank Corporation annual report <strong>2012</strong>45
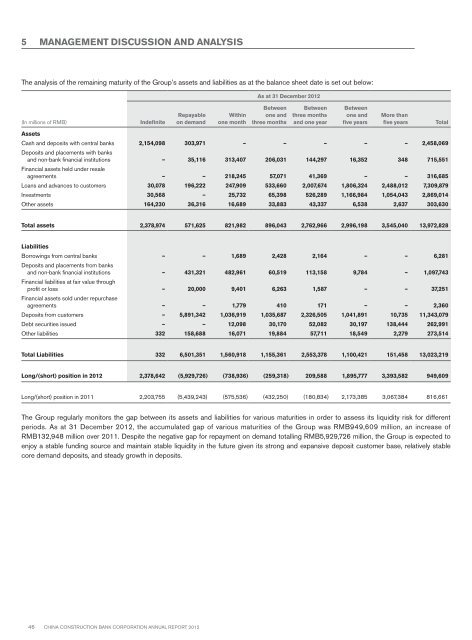
5 MANAGEMENT DISCUSSION AND ANALYSISThe analysis of the remaining maturity of the Group’s assets and liabilities as at the balance sheet date is set out below:(In millions of RMB)IndefiniteRepayableon demandWithinone monthAs at 31 December <strong>2012</strong>Betweenone andthree monthsBetweenthree monthsand one yearBetweenone andfive yearsMore thanfive yearsAssetsCash and deposits with central banks 2,154,098 303,971 – – – – – 2,458,069Deposits and placements with banksand non-bank financial institutions – 35,116 313,407 206,031 144,297 16,352 348 715,551Financial assets held under resaleagreements – – 218,245 57,071 41,369 – – 316,685Loans and advances to customers 30,078 196,222 247,909 533,660 2,007,674 1,806,324 2,488,012 7,309,879Investments 30,568 – 25,732 65,398 526,289 1,166,984 1,054,043 2,869,014Other assets 164,230 36,316 16,689 33,883 43,337 6,538 2,637 303,630TotalTotal assets 2,378,974 571,625 821,982 896,043 2,762,966 2,996,198 3,545,040 13,972,828LiabilitiesBorrowings from central banks – – 1,689 2,428 2,164 – – 6,281Deposits and placements from banksand non-bank financial institutions – 431,321 482,961 60,519 113,158 9,784 – 1,097,743Financial liabilities at fair value throughprofit or loss – 20,000 9,401 6,263 1,587 – – 37,251Financial assets sold under repurchaseagreements – – 1,779 410 171 – – 2,360Deposits from customers – 5,891,342 1,036,919 1,035,687 2,326,505 1,041,891 10,735 11,343,079Debt securities issued – – 12,098 30,170 52,082 30,197 138,444 262,991Other liabilities 332 158,688 16,071 19,884 57,711 18,549 2,279 273,514Total Liabilities 332 6,501,351 1,560,918 1,155,361 2,553,378 1,100,421 151,458 13,023,219Long/(short) position in <strong>2012</strong> 2,378,642 (5,929,726) (738,936) (259,318) 209,588 1,895,777 3,393,582 949,609Long/(short) position in 2011 2,203,755 (5,439,243) (575,536) (432,250) (180,834) 2,173,385 3,067,384 816,661The Group regularly monitors the gap between its assets and liabilities for various maturities in order to assess its liquidity risk for differentperiods. As at 31 December <strong>2012</strong>, the accumulated gap of various maturities of the Group was RMB949,609 million, an increase ofRMB132,948 million over 2011. Despite the negative gap for repayment on demand totalling RMB5,929,726 million, the Group is expected toenjoy a stable funding source and maintain stable liquidity in the future given its strong and expansive deposit customer base, relatively stablecore demand deposits, and steady growth in deposits.46 China Construction Bank Corporation annual report <strong>2012</strong>