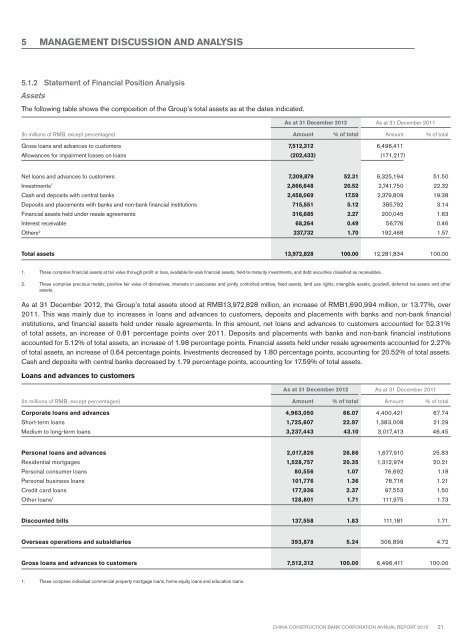
5 MANAGEMENT DISCUSSION AND ANALYSIS5.1.2 Statement of Financial Position AnalysisAssetsThe following table shows the composition of the Group’s total assets as at the dates indicated.As at 31 December <strong>2012</strong> As at 31 December 2011(In millions of RMB, except percentages) Amount % of total Amount % of totalGross loans and advances to customers 7,512,312 6,496,411Allowances for impairment losses on loans (202,433) (171,217)Net loans and advances to customers 7,309,879 52.31 6,325,194 51.50Investments 1 2,866,648 20.52 2,741,750 22.32Cash and deposits with central banks 2,458,069 17.59 2,379,809 19.38Deposits and placements with banks and non-bank financial institutions 715,551 5.12 385,792 3.14Financial assets held under resale agreements 316,685 2.27 200,045 1.63Interest receivable 68,264 0.49 56,776 0.46Others 2 237,732 1.70 192,468 1.57Total assets 13,972,828 100.00 12,281,834 100.001. These comprise financial assets at fair value through profit or loss, available-for-sale financial assets, held-to-maturity investments, and debt securities classified as receivables.2. These comprise precious metals, positive fair value of derivatives, interests in associates and jointly controlled entities, fixed assets, land use rights, intangible assets, goodwill, deferred tax assets and otherassets.As at 31 December <strong>2012</strong>, the Group’s total assets stood at RMB13,972,828 million, an increase of RMB1,690,994 million, or 13.77%, over2011. This was mainly due to increases in loans and advances to customers, deposits and placements with banks and non-bank financialinstitutions, and financial assets held under resale agreements. In this amount, net loans and advances to customers accounted for 52.31%of total assets, an increase of 0.81 percentage points over 2011. Deposits and placements with banks and non-bank financial institutionsaccounted for 5.12% of total assets, an increase of 1.98 percentage points. Financial assets held under resale agreements accounted for 2.27%of total assets, an increase of 0.64 percentage points. Investments decreased by 1.80 percentage points, accounting for 20.52% of total assets.Cash and deposits with central banks decreased by 1.79 percentage points, accounting for 17.59% of total assets.Loans and advances to customersAs at 31 December <strong>2012</strong> As at 31 December 2011(In millions of RMB, except percentages) Amount % of total Amount % of totalCorporate loans and advances 4,963,050 66.07 4,400,421 67.74Short-term loans 1,725,607 22.97 1,383,008 21.29Medium to long-term loans 3,237,443 43.10 3,017,413 46.45Personal loans and advances 2,017,826 26.86 1,677,910 25.83Residential mortgages 1,528,757 20.35 1,312,974 20.21Personal consumer loans 80,556 1.07 76,692 1.18Personal business loans 101,776 1.36 78,716 1.21Credit card loans 177,936 2.37 97,553 1.50Other loans 1 128,801 1.71 111,975 1.73Discounted bills 137,558 1.83 111,181 1.71Overseas operations and subsidiaries 393,878 5.24 306,899 4.72Gross loans and advances to customers 7,512,312 100.00 6,496,411 100.001. These comprise individual commercial property mortgage loans, home equity loans and education loans.China Construction Bank Corporation annual report <strong>2012</strong>21
5 MANAGEMENT DISCUSSION AND ANALYSISAs at 31 December <strong>2012</strong>, the Group’s gross loans and advances to customers rose by RMB1,015,901 million, or 15.64%, over 2011, toRMB7,512,312 million.Domestic corporate loans and advances of the Bank reached RMB4,963,050 million, an increase of RMB562,629 million, or 12.79%, over2011. In this amount, loans to infrastructure sectors rose to RMB2,096,129 million, the increase of which accounted for 27.04% of the increasein corporate loans; loans to small and micro businesses amounted to RMB745,453 million, and agriculture-related loans totalled RMB1,274,899million, up 17.97% and 21.43% respectively, both higher than the growth rate of total corporate loans. The Bank pushed forward the rectificationof its loans to local government financing vehicles, strengthened the exit mechanism, and strictly followed the approval policies, leading toimproved structure of loans to financing vehicles. Proportions of loans to industries classified as prudent supporting and gradual curtailingcategories in total loans decreased by 0.89 percentage points and 0.26 percentage points respectively.Domestic personal loans and advances of the Bank increased by RMB339,916 million, or 20.26%, to RMB2,017,826 million, which accountedfor 26.86% of the gross loans and advances to customers, up 1.03 percentage points over 2011. In this amount, residential mortgages rose byRMB215,783 million, or 16.43%, to RMB1,528,757 million, mainly to support the financing needs for residential purpose; personal businessloans increased by RMB23,060 million, or 29.30% over 2011, to RMB101,776 million; credit card loans rose by RMB80,383 million, or82.40%, to RMB177,936 million.Discounted bills increased by RMB26,377 million to RMB137,558 million year-on-year, chiefly used to meet the short-term financing needs oftargeted prime customers.Loans and advances to customers of overseas entities and subsidiaries rose by RMB86,979 million, or 28.34%, over 2011, to RMB393,878million, largely attributable to the rapid loan growth in Hong Kong and other regions.Distribution of loans by type of collateralThe table below sets forth the distribution of loans and advances by type of collateral as at the dates indicated.As at 31 December <strong>2012</strong> As at 31 December 2011(In millions of RMB, except percentages) Amount % of total Amount % of totalUnsecured loans 2,084,988 27.76 1,655,537 25.48Guaranteed loans 1,441,826 19.19 1,422,349 21.89Loans secured by tangible assets other than monetary assets 3,176,420 42.28 2,787,776 42.92Loans secured by monetary assets 809,078 10.77 630,749 9.71Gross loans and advances to customers 7,512,312 100.00 6,496,411 100.00Allowances for impairment losses on loans and advances to customersYear ended 31 December <strong>2012</strong>Allowances forloans andAllowances for impaired loansand advances(In millions of RMB)advanceswhich arecollectivelyassessedwhich arecollectivelyassessedwhich areindividuallyassessedTotalAs at 1 January 129,832 3,276 38,109 171,217Charge for the year 22,878 1,371 23,024 47,273Release during the year – – (8,943) (8,943)Unwinding of discount – – (1,612) (1,612)Transfers out – (5) (232) (237)Write-offs – (832) (5,821) (6,653)Recoveries – 99 1,289 1,388As at 31 December 152,710 3,909 45,814 202,433The Group adhered to the prudent principle by fully considering the impact of changes in external environment including macro economy andgovernment control policies on credit asset quality, and made full provisions for impairment losses on loans and advances to customers. Asat 31 December <strong>2012</strong>, the allowances for impairment losses on loans and advances to customers were RMB202,433 million, an increase ofRMB31,216 million over 2011. The ratio of allowances to non-performing loans was 271.29%, up 29.85 percentage points over 2011. The ratioof allowances to total loans stood at 2.69%, up 0.05 percentage points over 2011.22 China Construction Bank Corporation annual report <strong>2012</strong>