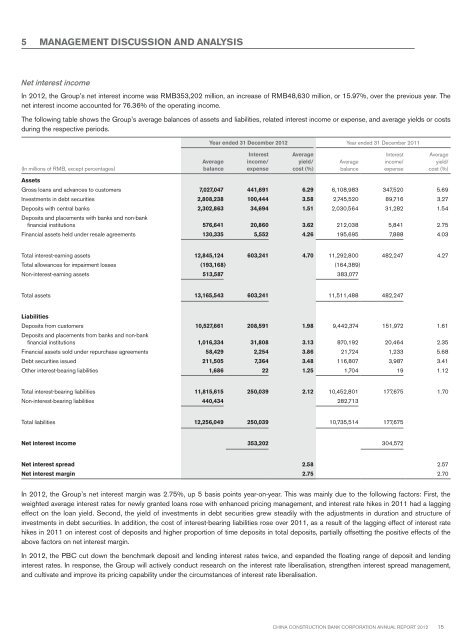
5 MANAGEMENT DISCUSSION AND ANALYSISNet interest incomeIn <strong>2012</strong>, the Group’s net interest income was RMB353,202 million, an increase of RMB48,630 million, or 15.97%, over the previous year. Thenet interest income accounted for 76.36% of the operating income.The following table shows the Group’s average balances of assets and liabilities, related interest income or expense, and average yields or costsduring the respective periods.(In millions of RMB, except percentages)Year ended 31 December <strong>2012</strong> Year ended 31 December 2011AveragebalanceInterestincome/expenseAverageyield/cost (%)AveragebalanceInterestincome/expenseAverageyield/cost (%)AssetsGross loans and advances to customers 7,027,047 441,691 6.29 6,108,983 347,520 5.69Investments in debt securities 2,808,238 100,444 3.58 2,745,520 89,716 3.27Deposits with central banks 2,302,863 34,694 1.51 2,030,564 31,282 1.54Deposits and placements with banks and non-bankfinancial institutions 576,641 20,860 3.62 212,038 5,841 2.75Financial assets held under resale agreements 130,335 5,552 4.26 195,695 7,888 4.03Total interest-earning assets 12,845,124 603,241 4.70 11,292,800 482,247 4.27Total allowances for impairment losses (193,168) (164,389)Non-interest-earning assets 513,587 383,077Total assets 13,165,543 603,241 11,511,488 482,247LiabilitiesDeposits from customers 10,527,661 208,591 1.98 9,442,374 151,972 1.61Deposits and placements from banks and non-bankfinancial institutions 1,016,334 31,808 3.13 870,192 20,464 2.35Financial assets sold under repurchase agreements 58,429 2,254 3.86 21,724 1,233 5.68Debt securities issued 211,505 7,364 3.48 116,807 3,987 3.41Other interest-bearing liabilities 1,686 22 1.25 1,704 19 1.12Total interest-bearing liabilities 11,815,615 250,039 2.12 10,452,801 177,675 1.70Non-interest-bearing liabilities 440,434 282,713Total liabilities 12,256,049 250,039 10,735,514 177,675Net interest income 353,202 304,572Net interest spread 2.58 2.57Net interest margin 2.75 2.70In <strong>2012</strong>, the Group’s net interest margin was 2.75%, up 5 basis points year-on-year. This was mainly due to the following factors: First, theweighted average interest rates for newly granted loans rose with enhanced pricing management, and interest rate hikes in 2011 had a laggingeffect on the loan yield. Second, the yield of investments in debt securities grew steadily with the adjustments in duration and structure ofinvestments in debt securities. In addition, the cost of interest-bearing liabilities rose over 2011, as a result of the lagging effect of interest ratehikes in 2011 on interest cost of deposits and higher proportion of time deposits in total deposits, partially offsetting the positive effects of theabove factors on net interest margin.In <strong>2012</strong>, the PBC cut down the benchmark deposit and lending interest rates twice, and expanded the floating range of deposit and lendinginterest rates. In response, the Group will actively conduct research on the interest rate liberalisation, strengthen interest spread management,and cultivate and improve its pricing capability under the circumstances of interest rate liberalisation.China Construction Bank Corporation annual report <strong>2012</strong>15
5 MANAGEMENT DISCUSSION AND ANALYSISThe following table shows the effects of the movement of the average balances and average interest rates of the Group’s assets and liabilities onthe change in interest income or expense for <strong>2012</strong> versus 2011.(In millions of RMB) Volume factor 1 Interest rate factor 1 income/expenseChange in interestAssetsGross loans and advances to customers 55,341 38,830 94,171Investment in debt securities 2,083 8,645 10,728Deposits with central banks 4,043 (631) 3,412Deposits and placements with banks and non-bank financial institutions 12,685 2,334 15,019Financial assets held under resale agreements (2,764) 428 (2,336)Change in interest income 71,388 49,606 120,994LiabilitiesDeposits from customers 18,876 37,743 56,619Deposits and placements from banks and non-bank financial institutions 3,811 7,533 11,344Financial assets sold under repurchase agreements 1,523 (502) 1,021Debt securities issued 3,294 83 3,377Other interest-bearing liabilities – 3 3Change in interest expenses 27,504 44,860 72,364Change in net interest income 43,884 4,746 48,6301. Change caused by both average balances and average interest rates was allocated to volume factor and interest rate factor respectively based on the respective proportions of absolute values of volume factorand interest rate factor.Net interest income increased by RMB48,630 million over the previous year, in which an increase of RMB43,884 million was due to themovement of average balances of assets and liabilities, and an increase of RMB4,746 million was due to the movement of average yields orcosts. The proportion of contribution of volume factor and interest rate factor to the increase in net interest income was 90.24% and 9.76%respectively.Interest incomeThe Group’s interest income in <strong>2012</strong> was RMB603,241 million, an increase of RMB120,994 million, or 25.09%, over 2011. In this amount, theproportion of interest income from loans and advances to customers, investments in debt securities, deposits with central banks, deposits andplacements with banks and non-bank financial institutions, financial assets held under resale agreements was 73.22%, 16.65%, 5.75%, 3.46%and 0.92% respectively.Interest income from loans and advances to customersThe table below shows the average balance, interest income and average yield of each component of the Group’s loans and advances tocustomers.Year ended 31 December <strong>2012</strong> Year ended 31 December 2011(In millions of RMB, except percentages)AveragebalanceInterestincomeAverageyield (%)AveragebalanceInterestincomeAverageyield (%)Corporate loans and advances 4,690,345 307,355 6.55 4,201,411 249,226 5.93Short-term loans 1,619,010 104,219 6.44 1,313,801 76,110 5.79Medium to long-term loans 3,071,335 203,136 6.61 2,887,610 173,116 6.00Personal loans and advances 1,833,083 112,586 6.14 1,538,049 82,732 5.38Discounted bills 127,147 8,694 6.84 103,290 7,496 7.26Overseas operations and subsidiaries 376,472 13,056 3.47 266,233 8,066 3.03Gross loans and advances to customers 7,027,047 441,691 6.29 6,108,983 347,520 5.6916 China Construction Bank Corporation annual report <strong>2012</strong>
- Page 1 and 2: Annual Report 2012China Constructio
- Page 3 and 4: DEFINITIONSIn this annual report, u
- Page 5 and 6: INTRODUCTIONHeadquartered in Beijin
- Page 7 and 8: 2 CORPORATE INFORMATIONLegal name a
- Page 9 and 10: 2 CORPORATE INFORMATIONForbes Ranke
- Page 11 and 12: 3 CHAIRMAN’S STATEMENTDear shareh
- Page 13 and 14: 4 PRESIDENT’S REPORTDear sharehol
- Page 15: 5 MANAGEMENT DISCUSSION AND ANALYSI
- Page 19 and 20: 5 MANAGEMENT DISCUSSION AND ANALYSI
- Page 21 and 22: 5 MANAGEMENT DISCUSSION AND ANALYSI
- Page 23 and 24: 5 MANAGEMENT DISCUSSION AND ANALYSI
- Page 25 and 26: 5 MANAGEMENT DISCUSSION AND ANALYSI
- Page 27 and 28: 5 MANAGEMENT DISCUSSION AND ANALYSI
- Page 29 and 30: 5 MANAGEMENT DISCUSSION AND ANALYSI
- Page 31 and 32: 5 MANAGEMENT DISCUSSION AND ANALYSI
- Page 33 and 34: 5 MANAGEMENT DISCUSSION AND ANALYSI
- Page 35 and 36: 5 MANAGEMENT DISCUSSION AND ANALYSI
- Page 37 and 38: 5 MANAGEMENT DISCUSSION AND ANALYSI
- Page 39 and 40: 5 MANAGEMENT DISCUSSION AND ANALYSI
- Page 41 and 42: 5 MANAGEMENT DISCUSSION AND ANALYSI
- Page 43 and 44: 5 MANAGEMENT DISCUSSION AND ANALYSI
- Page 45 and 46: 5 MANAGEMENT DISCUSSION AND ANALYSI
- Page 47 and 48: 5 MANAGEMENT DISCUSSION AND ANALYSI
- Page 49 and 50: 5 MANAGEMENT DISCUSSION AND ANALYSI
- Page 51 and 52: 5 MANAGEMENT DISCUSSION AND ANALYSI
- Page 53 and 54: 6 CHANGES IN SHARE CAPITAL AND PART
- Page 55 and 56: 6 CHANGES IN SHARE CAPITAL AND PART
- Page 57 and 58: 7 CORPORATE GOVERNANCE REPORT7.2 BO
- Page 59 and 60: 7 CORPORATE GOVERNANCE REPORTBoard
- Page 61 and 62: 7 CORPORATE GOVERNANCE REPORTImpact
- Page 63 and 64: 7 CORPORATE GOVERNANCE REPORTAudit
- Page 65 and 66: 7 CORPORATE GOVERNANCE REPORTNomina
- Page 67 and 68:
7 CORPORATE GOVERNANCE REPORTCompos
- Page 69 and 70:
7 CORPORATE GOVERNANCE REPORTIn 201
- Page 71 and 72:
7 CORPORATE GOVERNANCE REPORTEffect
- Page 73 and 74:
8 PROFILES OF DIRECTORS, SUPERVISOR
- Page 75 and 76:
8 PROFILES OF DIRECTORS, SUPERVISOR
- Page 77 and 78:
8 PROFILES OF DIRECTORS, SUPERVISOR
- Page 79 and 80:
8 PROFILES OF DIRECTORS, SUPERVISOR
- Page 81 and 82:
8 PROFILES OF DIRECTORS, SUPERVISOR
- Page 83 and 84:
9 REPORT OF THE BOARD OF DIRECTORSP
- Page 85 and 86:
9 REPORT OF THE BOARD OF DIRECTORSD
- Page 87 and 88:
10 REPORT OF THE BOARD OF SUPERVISO
- Page 89 and 90:
11 MAJOR ISSUESMaterial litigations
- Page 91 and 92:
11 MAJOR ISSUESInterests in non-lis
- Page 93 and 94:
Consolidated statement of comprehen
- Page 95 and 96:
Statement of financial positionAs a
- Page 97 and 98:
Statement of changes in equityFor t
- Page 99 and 100:
Consolidated statement of cash flow
- Page 101 and 102:
Notes to the financial statements(E
- Page 103 and 104:
Notes to the financial statements(E
- Page 105 and 106:
Notes to the financial statements(E
- Page 107 and 108:
Notes to the financial statements(E
- Page 109 and 110:
Notes to the financial statements(E
- Page 111 and 112:
Notes to the financial statements(E
- Page 113 and 114:
Notes to the financial statements(E
- Page 115 and 116:
Notes to the financial statements(E
- Page 117 and 118:
Notes to the financial statements(E
- Page 119 and 120:
Notes to the financial statements(E
- Page 121 and 122:
Notes to the financial statements(E
- Page 123 and 124:
Notes to the financial statements(E
- Page 125 and 126:
Notes to the financial statements(E
- Page 127 and 128:
Notes to the financial statements(E
- Page 129 and 130:
Notes to the financial statements(E
- Page 131 and 132:
Notes to the financial statements(E
- Page 133 and 134:
Notes to the financial statements(E
- Page 135 and 136:
Notes to the financial statements(E
- Page 137 and 138:
Notes to the financial statements(E
- Page 139 and 140:
Notes to the financial statements(E
- Page 141 and 142:
Notes to the financial statements(E
- Page 143 and 144:
Notes to the financial statements(E
- Page 145 and 146:
Notes to the financial statements(E
- Page 147 and 148:
Notes to the financial statements(E
- Page 149 and 150:
Notes to the financial statements(E
- Page 151 and 152:
Notes to the financial statements(E
- Page 153 and 154:
Notes to the financial statements(E
- Page 155 and 156:
Notes to the financial statements(E
- Page 157 and 158:
Notes to the financial statements(E
- Page 159 and 160:
Notes to the financial statements(E
- Page 161 and 162:
Notes to the financial statements(E
- Page 163 and 164:
Notes to the financial statements(E
- Page 165 and 166:
Notes to the financial statements(E
- Page 167 and 168:
Notes to the financial statements(E
- Page 169 and 170:
Notes to the financial statements(E
- Page 171 and 172:
Notes to the financial statements(E
- Page 173 and 174:
Notes to the financial statements(E
- Page 175 and 176:
Notes to the financial statements(E
- Page 177 and 178:
Notes to the financial statements(E
- Page 179 and 180:
Notes to the financial statements(E
- Page 181 and 182:
Notes to the financial statements(E
- Page 183 and 184:
Notes to the financial statements(E
- Page 185 and 186:
Notes to the financial statements(E
- Page 187 and 188:
Notes to the financial statements(E
- Page 189 and 190:
Notes to the financial statements(E
- Page 191 and 192:
Notes to the financial statements(E
- Page 193 and 194:
Notes to the financial statements(E
- Page 195 and 196:
Notes to the financial statements(E
- Page 197 and 198:
Notes to the financial statements(E
- Page 199 and 200:
Notes to the financial statements(E
- Page 201 and 202:
Notes to the financial statements(E
- Page 203 and 204:
Notes to the financial statements(E
- Page 205 and 206:
Notes to the financial statements(E
- Page 207 and 208:
Notes to the financial statements(E
- Page 209 and 210:
Notes to the financial statements(E
- Page 211 and 212:
14 UNAUDITED SUPPLEMENTARY FINANCIA
- Page 213 and 214:
15 ORGANISATIONAL STRUCTUREPublic R
- Page 215 and 216:
16 BRANCHES AND SUBSIDIARIESTier-on
- Page 217 and 218:
16 BRANCHES AND SUBSIDIARIESBranche
- Page 219 and 220:
16 BRANCHES AND SUBSIDIARIESChongqi
- Page 221:
16 BRANCHES AND SUBSIDIARIESZhejian