Annual Report 2012
Annual Report 2012
Annual Report 2012
- No tags were found...

Create successful ePaper yourself
Turn your PDF publications into a flip-book with our unique Google optimized e-Paper software.
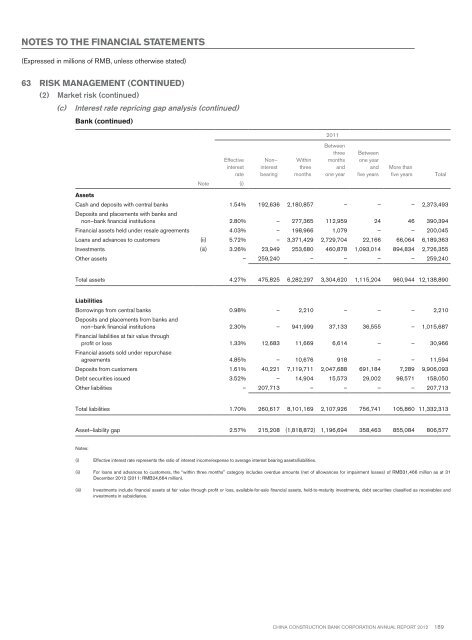
Notes to the financial statements(Expressed in millions of RMB, unless otherwise stated)63 Risk Management (continued)(2) Market risk (continued)(c) Interest rate repricing gap analysis (continued)Bank (continued)2011EffectiveinterestrateNon–interestbearingWithinthreemonthsBetweenthreemonthsandone yearBetweenone yearandfive yearsMore thanfive yearsTotalNote(i)AssetsCash and deposits with central banks 1.54% 192,636 2,180,857 – – – 2,373,493Deposits and placements with banks andnon–bank financial institutions 2.80% – 277,365 112,959 24 46 390,394Financial assets held under resale agreements 4.03% – 198,966 1,079 – – 200,045Loans and advances to customers (ii) 5.72% – 3,371,429 2,729,704 22,166 66,064 6,189,363Investments (iii) 3.26% 23,949 253,680 460,878 1,093,014 894,834 2,726,355Other assets – 259,240 – – – – 259,240Total assets 4.27% 475,825 6,282,297 3,304,620 1,115,204 960,944 12,138,890LiabilitiesBorrowings from central banks 0.98% – 2,210 – – – 2,210Deposits and placements from banks andnon–bank financial institutions 2.30% – 941,999 37,133 36,555 – 1,015,687Financial liabilities at fair value throughprofit or loss 1.33% 12,683 11,669 6,614 – – 30,966Financial assets sold under repurchaseagreements 4.85% – 10,676 918 – – 11,594Deposits from customers 1.61% 40,221 7,119,711 2,047,688 691,184 7,289 9,906,093Debt securities issued 3.52% – 14,904 15,573 29,002 98,571 158,050Other liabilities – 207,713 – – – – 207,713Total liabilities 1.70% 260,617 8,101,169 2,107,926 756,741 105,860 11,332,313Asset–liability gap 2.57% 215,208 (1,818,872) 1,196,694 358,463 855,084 806,577Notes:(i)Effective interest rate represents the ratio of interest income/expense to average interest bearing assets/liabilities.(ii) For loans and advances to customers, the “within three months” category includes overdue amounts (net of allowances for impairment losses) of RMB31,466 million as at 31December <strong>2012</strong> (2011: RMB24,664 million).(iii)Investments include financial assets at fair value through profit or loss, available-for-sale financial assets, held-to-maturity investments, debt securities classified as receivables andinvestments in subsidiaries.China Construction Bank Corporation annual report <strong>2012</strong>189