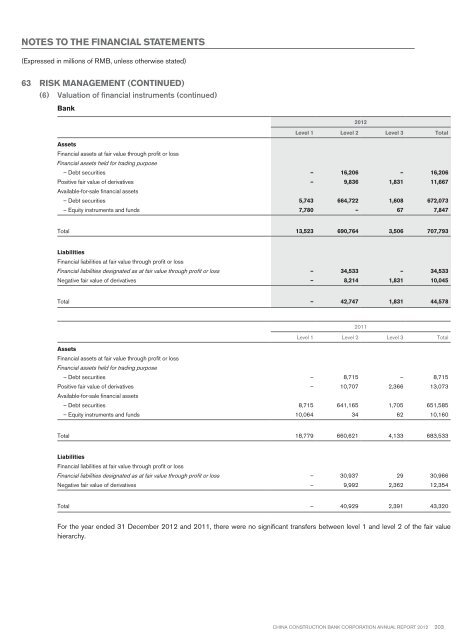
Notes to the financial statements(Expressed in millions of RMB, unless otherwise stated)63 Risk Management (continued)(6) Valuation of financial instruments (continued)Bank<strong>2012</strong>Level 1 Level 2 Level 3 TotalAssetsFinancial assets at fair value through profit or lossFinancial assets held for trading purpose– Debt securities – 16,206 – 16,206Positive fair value of derivatives – 9,836 1,831 11,667Available-for-sale financial assets– Debt securities 5,743 664,722 1,608 672,073– Equity instruments and funds 7,780 – 67 7,847Total 13,523 690,764 3,506 707,793LiabilitiesFinancial liabilities at fair value through profit or lossFinancial liabilities designated as at fair value through profit or loss – 34,533 – 34,533Negative fair value of derivatives – 8,214 1,831 10,045Total – 42,747 1,831 44,5782011Level 1 Level 2 Level 3 TotalAssetsFinancial assets at fair value through profit or lossFinancial assets held for trading purpose– Debt securities – 8,715 – 8,715Positive fair value of derivatives – 10,707 2,366 13,073Available-for-sale financial assets– Debt securities 8,715 641,165 1,705 651,585– Equity instruments and funds 10,064 34 62 10,160Total 18,779 660,621 4,133 683,533LiabilitiesFinancial liabilities at fair value through profit or lossFinancial liabilities designated as at fair value through profit or loss – 30,937 29 30,966Negative fair value of derivatives – 9,992 2,362 12,354Total – 40,929 2,391 43,320For the year ended 31 December <strong>2012</strong> and 2011, there were no significant transfers between level 1 and level 2 of the fair valuehierarchy.China Construction Bank Corporation annual report <strong>2012</strong>203
Notes to the financial statements(Expressed in millions of RMB, unless otherwise stated)63 Risk Management (continued)(6) Valuation of financial instruments (continued)The following table shows a reconciliation from the opening balances to the ending balances for fair value measurement in level 3 ofthe fair value hierarchy:Group<strong>2012</strong>Financial assetsdesignatedas at fair valuethrough profit or lossDebtsecuritiesEquityinstrumentsand fundsPositivefair value ofderivativesAvailable-for-salefinancial assetsDebtsecuritiesEquityinstrumentsand fundsTotal assetsFinancialliabilitiesdesignatedas atfair valuethroughprofit or lossNegativefairvalue ofderivativesTotalliabilitiesAs at 1 January <strong>2012</strong> 4,483 6,319 2,418 4,565 552 18,337 (2,719) (2,450) (5,169)Total gains or losses:In profit or loss 120 (714) (423) (24) – (1,041) (28) 371 343In other comprehensive income – – – 194 20 214 – – –Purchases 485 581 – 2,545 721 4,332 – – –Sales and settlements (1,947) (1,171) (164) (2,947) (810) (7,039) 29 248 277Transfer out – (255) – – (11) (266) – – –As at 31 December <strong>2012</strong> 3,141 4,760 1,831 4,333 472 14,537 (2,718) (1,831) (4,549)Total gains or losses for the periodincluded in profit or loss forassets and liabilities held at theend of the reporting period 75 (227) (214) (24) – (390) (28) 161 1332011Financial assetsdesignatedas at fair valuethrough profit or lossDebtsecuritiesEquityinstrumentsand fundsPositivefairvalue ofderivativesAvailable-for-salefinancial assetsDebtsecuritiesEquityinstrumentsand fundsTotalassetsFinancialliabilitiesdesignatedas atfair valuethroughprofit or lossNegativefairvalue ofderivativesTotalliabilitiesAs at 1 January 2011 2,999 3,571 2,461 4,140 374 13,545 (2,371) (2,146) (4,517)Total gains or losses:In profit or loss (330) 129 93 370 – 262 (48) (436) (484)In other comprehensive income – – – (266) (28) (294) – – –Purchases 3,091 3,244 35 2,085 207 8,662 (655) (88) (743)Sales and settlements (1,277) (625) (193) (1,860) (1) (3,956) 355 191 546Transfer in/out – – 22 96 – 118 – 29 29As at 31 December 2011 4,483 6,319 2,418 4,565 552 18,337 (2,719) (2,450) (5,169)Total gains or losses for the periodincluded in profit or loss forassets and liabilities held at theend of the reporting period (334) 129 631 370 – 796 (48) (1,027) (1,075)204 China Construction Bank Corporation annual report <strong>2012</strong>