Annual Report 2012
Annual Report 2012
Annual Report 2012
- No tags were found...

Create successful ePaper yourself
Turn your PDF publications into a flip-book with our unique Google optimized e-Paper software.
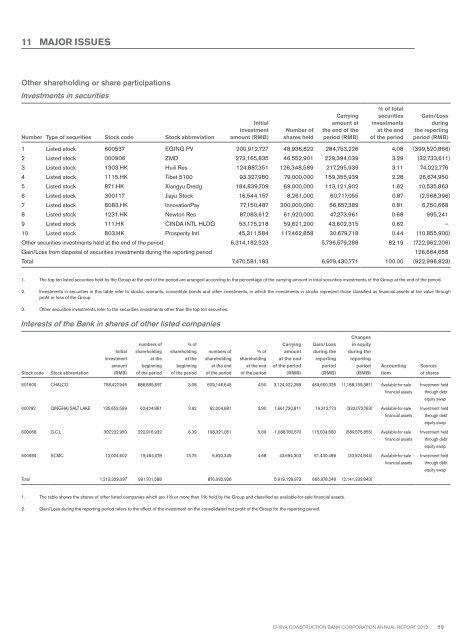
11 MAJOR ISSUESOther shareholding or share participationsInvestments in securitiesNumber Type of securities Stock code Stock abbreviationInitialinvestmentamount (RMB)Number ofshares heldCarryingamount atthe end of theperiod (RMB)% of totalsecuritiesinvestmentsat the endof the periodGain/Lossduringthe reportingperiod (RMB)1 Listed stock 600537 EGING PV 200,912,727 48,936,822 284,753,226 4.08 (399,520,866)2 Listed stock 000906 ZMD 273,165,835 46,552,901 229,394,039 3.29 (32,733,611)3 Listed stock 1303.HK Huili Res 124,887,351 126,348,589 217,295,939 3.11 74,022,7764 Listed stock 1115.HK Tibet 5100 93,327,980 79,000,000 159,355,939 2.28 26,674,9505 Listed stock 871.HK Xiangyu Dredg 184,839,709 69,000,000 113,121,902 1.62 10,535,8636 Listed stock 300117 Jiayu Stock 16,544,157 8,261,000 60,717,055 0.87 (2,568,396)7 Listed stock 8083.HK InnovationPay 77,150,487 300,000,000 56,657,389 0.81 6,750,6688 Listed stock 1231.HK Newton Res 87,083,612 61,920,000 47,273,961 0.68 995,2419 Listed stock 111.HK CINDA INTL HLDG 53,175,218 59,621,200 43,602,315 0.62 –10 Listed stock 803.HK Prosperity Intl 45,311,584 117,462,858 30,679,718 0.44 (10,855,900)Other securities investments held at the end of the period 6,314,182,523 5,736,579,288 82.19 (722,962,206)Gain/Loss from disposal of securities investments during the reporting period 126,664,658Total 7,470,581,183 6,979,430,771 100.00 (922,996,823)1. The top ten listed securities held by the Group at the end of the period are arranged according to the percentage of the carrying amount in total securities investments of the Group at the end of the period.2. Investments in securities in this table refer to stocks, warrants, convertible bonds and other investments, in which the investments in stocks represent those classified as financial assets at fair value throughprofit or loss of the Group.3. Other securities investments refer to the securities investments other than the top ten securities.Interests of the Bank in shares of other listed companiesChangesStock codeStock abbreviationInitialinvestmentamount(RMB)numbers ofshareholdingat thebeginningof the period% ofshareholdingat thebeginningof the periodnumbers ofshareholdingat the endof the period% ofshareholdingat the endof the periodCarryingamountat the endof the period(RMB)Gain/Lossduring thereportingperiod(RMB)in equityduring thereportingperiod(RMB)AccountingitemSourcesof shares601600 CHALCO 758,427,946 686,895,697 5.08 609,146,645 4.50 3,124,922,289 469,600,326 (1,188,159,381) Available-for-salefinancial assets000792 QINGHAI SALT LAKE 135,653,599 62,424,881 3.92 62,004,881 3.90 1,661,730,811 19,312,773 (333,073,763) Available-for-salefinancial assets600068 G.C.L 307,222,950 222,916,932 6.39 198,321,051 5.69 1,088,782,570 115,634,660 (589,575,855) Available-for-salefinancial assets600984 SCMC 12,024,602 19,464,078 13.75 6,620,349 4.68 43,694,303 61,430,489 (30,524,844) Available-for-salefinancial assetsInvestment heldthrough debtequity swapInvestment heldthrough debtequity swapInvestment heldthrough debtequity swapInvestment heldthrough debtequity swapTotal 1,213,329,097 991,701,588 876,092,926 5,919,129,973 665,978,248 (2,141,333,843)1. The table shows the shares of other listed companies which are 1% or more than 1% held by the Group and classified as available-for-sale financial assets.2. Gain/Loss during the reporting period refers to the effect of the investment on the consolidated net profit of the Group for the reporting period.China Construction Bank Corporation annual report <strong>2012</strong>89