Annual Report 2012
Annual Report 2012
Annual Report 2012
- No tags were found...

You also want an ePaper? Increase the reach of your titles
YUMPU automatically turns print PDFs into web optimized ePapers that Google loves.
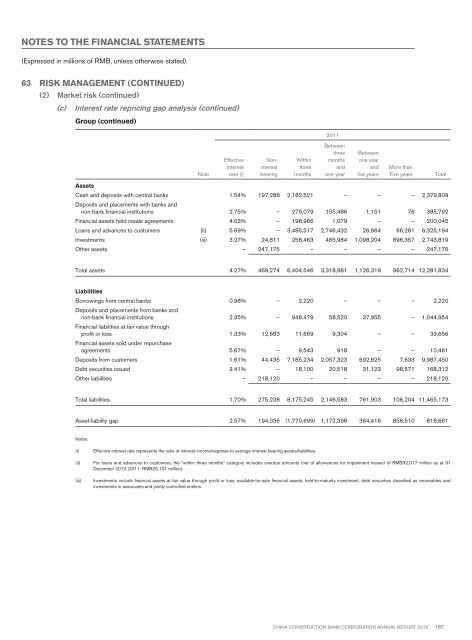
Notes to the financial statements(Expressed in millions of RMB, unless otherwise stated)63 Risk Management (continued)(2) Market risk (continued)(c) Interest rate repricing gap analysis (continued)Group (continued)2011NoteEffectiveinterestrate (i)NoninterestbearingWithinthreemonthsBetweenthreemonthsandone yearBetweenone yearandfive yearsMore thanFive yearsTotalAssetsCash and deposits with central banks 1.54% 197,288 2,182,521 – – – 2,379,809Deposits and placements with banks andnon-bank financial institutions 2.75% – 279,079 105,486 1,151 76 385,792Financial assets held resale agreements 4.03% – 198,966 1,079 – – 200,045Loans and advances to customers (ii) 5.69% – 3,485,517 2,746,432 26,964 66,281 6,325,194Investments (iii) 3.27% 24,811 258,463 465,984 1,098,204 896,357 2,743,819Other assets – 247,175 – – – – 247,175Total assets 4.27% 469,274 6,404,546 3,318,981 1,126,319 962,714 12,281,834LiabilitiesBorrowings from central banks 0.98% – 2,220 – – – 2,220Deposits and placements from banks andnon-bank financial institutions 2.35% – 948,479 58,520 37,955 – 1,044,954Financial liabilities at fair value throughprofit or loss 1.33% 12,683 11,669 9,304 – – 33,656Financial assets sold under repurchaseagreements 5.67% – 9,543 918 – – 10,461Deposits from customers 1.61% 44,435 7,185,234 2,057,323 692,825 7,633 9,987,450Debt securities issued 3.41% – 18,100 20,518 31,123 98,571 168,312Other liabilities – 218,120 – – – – 218,120Total liabilities 1.70% 275,238 8,175,245 2,146,583 761,903 106,204 11,465,173Asset-liability gap 2.57% 194,036 (1,770,699) 1,172,398 364,416 856,510 816,661Notes:(i)Effective interest rate represents the ratio of interest income/expense to average interest bearing assets/liabilities.(ii) For loans and advances to customers, the “within three months” category includes overdue amounts (net of allowances for impairment losses) of RMB32,017 million as at 31December <strong>2012</strong> (2011: RMB25,121 million).(iii)Investments include financial assets at fair value through profit or loss, available-for-sale financial assets, held-to-maturity investment, debt securities classified as receivables andinvestments in associates and jointly controlled entities.China Construction Bank Corporation annual report <strong>2012</strong>187