Informe mundial sobre la violencia y la salud editado por ... - teach-vip
Informe mundial sobre la violencia y la salud editado por ... - teach-vip
Informe mundial sobre la violencia y la salud editado por ... - teach-vip

You also want an ePaper? Increase the reach of your titles
YUMPU automatically turns print PDFs into web optimized ePapers that Google loves.
30 • INFORME MUNDIAL SOBRE LA VIOLENCIA Y LA SALUD<br />
estables (de alrededor de 2,4 <strong>por</strong><br />
100 000). En México, donde <strong>la</strong>s<br />
agresiones con armas de fuego provocan<br />
más o menos el 50% de los<br />
homicidios de jóvenes, <strong>la</strong>s tasas<br />
permanecieron altas y estables y aumentaron<br />
de 14,7 <strong>por</strong> 100 000 a<br />
15,6 <strong>por</strong> 100 000. Por otra parte,<br />
en Colombia los homicidios de jóvenes<br />
aumentaron en 159%, de<br />
36,7 <strong>por</strong> 100 000 a 95,0 <strong>por</strong><br />
100 000 (a fines de este período,<br />
80% de los homicidios fueron perpetrados<br />
con armas de fuego) y en<br />
Venezue<strong>la</strong> crecieron en 132%, de<br />
10,4 <strong>por</strong> 100 000 a 24,1 <strong>por</strong><br />
100 000.<br />
En Australia, <strong>la</strong> tasa de homicidios<br />
en los jóvenes descendió de<br />
2,0 <strong>por</strong> 100 000 en 1985 a 1,5<br />
<strong>por</strong> 100 000 en 1994, mientras<br />
que en <strong>la</strong> vecina Nueva Ze<strong>la</strong>ndia se<br />
incrementó a más del doble en el<br />
período mencionado, de 0,8 <strong>por</strong><br />
100 000 a 2,2 <strong>por</strong> 100 000. En el<br />
Japón, <strong>la</strong>s tasas permanecieron bajas<br />
en el período (en alrededor de<br />
0,4 <strong>por</strong> 100 000).<br />
Violencia no mortal<br />
En algunos países, los datos <strong>sobre</strong><br />
los homicidios juveniles pueden<br />
ser interpretados conjuntamente<br />
con los datos provenientes de estudios<br />
<strong>sobre</strong> <strong>la</strong> <strong>violencia</strong> no mortal.<br />
Tales comparaciones pro<strong>por</strong>cionan<br />
una imagen más completa del<br />
problema de <strong>la</strong> <strong>violencia</strong> juvenil.<br />
Los estudios de <strong>la</strong> <strong>violencia</strong> no<br />
mortal reve<strong>la</strong>n que, <strong>por</strong> cada homicidio<br />
juvenil, hay alrededor de<br />
20 a 40 víctimas no mortales de <strong>la</strong><br />
<strong>violencia</strong> juvenil que reciben tratamiento<br />
en hospitales. En algunos<br />
países, como <strong>por</strong> ejemplo en Israel,<br />
Nueva Ze<strong>la</strong>ndia y Nicaragua,<br />
<strong>la</strong> razón es aun mayor (17–19). En<br />
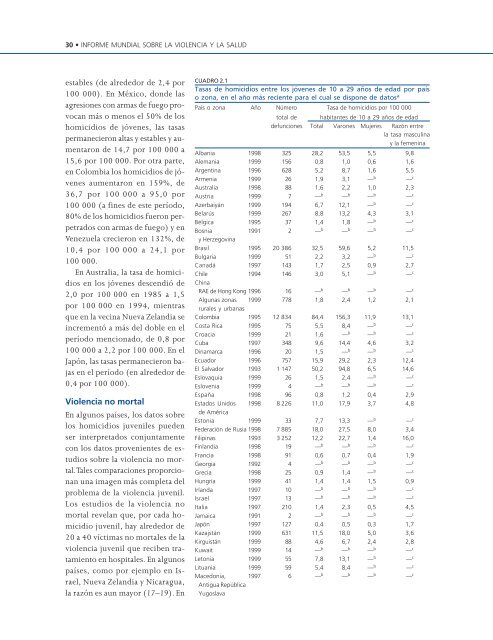
CUADRO 2.1<br />
Tasas de homicidios entre los jóvenes de 10 a 29 años de edad <strong>por</strong> país<br />
o zona, en el año más reciente para el cual se dispone de datos a<br />
País o zona Año Número Tasa de homicidios <strong>por</strong> 100 000<br />
total de habitantes de 10 a 29 años de edad<br />
defunciones Total Varones Mujeres Razón entre<br />
<strong>la</strong> tasa masculina<br />
y <strong>la</strong> femenina<br />
Albania 1998 325 28,2 53,5 5,5 9,8<br />
Alemania 1999 156 0,8 1,0 0,6 1,6<br />
Argentina 1996 628 5,2 8,7 1,6 5,5<br />
Armenia 1999 26 1,9 3,1 — b — c<br />
Australia 1998 88 1,6 2,2 1,0 2,3<br />
Austria 1999 7 — b — b — b — c<br />
Azerbaiyán 1999 194 6,7 12,1 — b — c<br />
Be<strong>la</strong>rús 1999 267 8,8 13,2 4,3 3,1<br />
Bélgica 1995 37 1,4 1,8 — b — c<br />
Bosnia 1991 2 — b — b — b — c<br />
y Herzegovina<br />
Brasil 1995 20 386 32,5 59,6 5,2 11,5<br />
Bulgaria 1999 51 2,2 3,2 — b — c<br />
Canadá 1997 143 1,7 2,5 0,9 2,7<br />
Chile 1994 146 3,0 5,1 — b — c<br />
China<br />
RAE de Hong Kong 1996 16 — b — b — b — c<br />
Algunas zonas 1999 778 1,8 2,4 1,2 2,1<br />
rurales y urbanas<br />
Colombia 1995 12 834 84,4 156,3 11,9 13,1<br />
Costa Rica 1995 75 5,5 8,4 — b — c<br />
Croacia 1999 21 1,6 — b — b — c<br />
Cuba 1997 348 9,6 14,4 4,6 3,2<br />
Dinamarca 1996 20 1,5 — b — b — c<br />
Ecuador 1996 757 15,9 29,2 2,3 12,4<br />
El Salvador 1993 1 147 50,2 94,8 6,5 14,6<br />
Eslovaquia 1999 26 1,5 2,4 — b — c<br />
Eslovenia 1999 4 — b — b — b — c<br />
España 1998 96 0,8 1,2 0,4 2,9<br />
Estados Unidos 1998 8 226 11,0 17,9 3,7 4,8<br />
de América<br />
Estonia 1999 33 7,7 13,3 — b — c<br />
Federación de Rusia 1998 7 885 18,0 27,5 8,0 3,4<br />
Filipinas 1993 3 252 12,2 22,7 1,4 16,0<br />
Fin<strong>la</strong>ndia 1998 19 — b — b — b — c<br />
Francia 1998 91 0,6 0,7 0,4 1,9<br />
Georgia 1992 4 — b — b — b — c<br />
Grecia 1998 25 0,9 1,4 — b — c<br />
Hungría 1999 41 1,4 1,4 1,5 0,9<br />
Ir<strong>la</strong>nda 1997 10 — b — b — b — c<br />
Israel 1997 13 — b — b — b — c<br />
Italia 1997 210 1,4 2,3 0,5 4,5<br />
Jamaica 1991 2 — b — b — b — c<br />
Japón 1997 127 0,4 0,5 0,3 1,7<br />
Kazajstán 1999 631 11,5 18,0 5,0 3,6<br />
Kirguistán 1999 88 4,6 6,7 2,4 2,8<br />
Kuwait 1999 14 — b — b — b — c<br />
Letonia 1999 55 7,8 13,1 — b — c<br />
Lituania 1999 59 5,4 8,4 — b — c<br />
Macedonia, 1997 6 — b — b — b — c<br />
Antigua República<br />
Yugos<strong>la</strong>va